- Community Home
- >
- Storage
- >
- Midrange and Enterprise Storage
- >
- StoreVirtual Storage
- >
- Re: Very poor performance on our 10 node Lefthand ...
Categories
Company
Local Language
Forums
Discussions
Forums
- Data Protection and Retention
- Entry Storage Systems
- Legacy
- Midrange and Enterprise Storage
- Storage Networking
- HPE Nimble Storage
Discussions
Discussions
Discussions
Forums
Discussions
Discussion Boards
Discussion Boards
Discussion Boards
Discussion Boards
- BladeSystem Infrastructure and Application Solutions
- Appliance Servers
- Alpha Servers
- BackOffice Products
- Internet Products
- HPE 9000 and HPE e3000 Servers
- Networking
- Netservers
- Secure OS Software for Linux
- Server Management (Insight Manager 7)
- Windows Server 2003
- Operating System - Tru64 Unix
- ProLiant Deployment and Provisioning
- Linux-Based Community / Regional
- Microsoft System Center Integration
Discussion Boards
Discussion Boards
Discussion Boards
Discussion Boards
Discussion Boards
Discussion Boards
Discussion Boards
Discussion Boards
Discussion Boards
Discussion Boards
Discussion Boards
Discussion Boards
Discussion Boards
Discussion Boards
Discussion Boards
Discussion Boards
Discussion Boards
Discussion Boards
Discussion Boards
Community
Resources
Forums
Blogs
- Subscribe to RSS Feed
- Mark Topic as New
- Mark Topic as Read
- Float this Topic for Current User
- Bookmark
- Subscribe
- Printer Friendly Page
- Mark as New
- Bookmark
- Subscribe
- Mute
- Subscribe to RSS Feed
- Permalink
- Report Inappropriate Content
04-23-2015 06:27 AM
04-23-2015 06:27 AM
Very poor performance on our 10 node Lefthand Cluster
We've been running the Lefthand solution for a number of years now and have never had any major problems with it. Day to day performance has been just fine and the only real issue we noted was that copying large amounts of data from one volume to another could sometimes be a little slow.
We're operating a ten node cluster running in a multi-site configuration. The vast majority of consumers are running inside vSphere v5.5 although we do have a small number of physical hosts that also access the storage. There are also a small number of hosts which don't have the volumes exposed by vSphere but instead have the DSM MPIO drivers installed and then use the software-based iSCSI Initiator in windows.
It was noted a few months ago that performance seemed to take a dip and coincidentally it seemed to happen at the time when we joined two StoreVirtual 4530 devices into the cluster. In order to do this we obviously had to upgrade to the latest version of SanIQ so it's not clear if adding the devices created the issue or if it's actually as a result of the software upgrade.
From an IOPS perpsective we're not seeing any major spikes. I've been monitoring during today and the max IOPS total is currently reporting 1,414. With a 10-node cluster we should expect to atain at least 16,000 IOPS, but I appreciate that in a mirror configuration we could expect to see less than that.
We've done monitoring in both the guest OS and also in vSphere and in both cases we don't see any huge demands being made on the storage.
Can anyone please assist in trouble-shooting the issue and determining why we're seeing such poor performance?
I should perhaps add at this point that one thing that has identified an issue is that we're recently started using CommVault as a means to backup the storage. Obviously any kind of backup is immediately going to highlight any deficiency in the read rate of the storage; and that's exactly what has happened. The person who handles our backup isn't complaining about speed but when the backup is running many of our other systems run extremely slowly.
The plan is that we'll monitor the IOPS total this evening when the backup kicks off again at 20:00 CET.
Grateful for any tips or requests for statistics that might help us track down the culprit with this (extremely complex) issue.
- Mark as New
- Bookmark
- Subscribe
- Mute
- Subscribe to RSS Feed
- Permalink
- Report Inappropriate Content
04-23-2015 05:05 PM
04-23-2015 05:05 PM
Re: Very poor performance on our 10 node Lefthand Cluster
Hi Peter,
What version of LHOS are you now running? Certainly version 12 that has just been released could help with your backups in conjunction with the VMware MEM driver (which should be back on the download site soon I'd imagine).
We run much smaller clusters but also use Commvault, with a mixture of VSA hot-add backups and in-guest agents. We typically stagger these so we don't negatively impact the running performance of the clusters.
Are all of your nodes 1GbE or 10GbE connected? Certainly 10GbE would help if you are performing lots of sequential backup IO that won't neccessarily have a large disk impact on that number of nodes but would likely saturate your 1GbE infrastructure impacting replication/sync, etc.
How did you get on monitoring the performance?
Cheers,
Ben
- Mark as New
- Bookmark
- Subscribe
- Mute
- Subscribe to RSS Feed
- Permalink
- Report Inappropriate Content
04-27-2015 02:17 AM
04-27-2015 02:17 AM
Re: Very poor performance on our 10 node Lefthand Cluster
Hi Ben,
Sorry for the delay replying - it's been a manic few days.
We just recently ugraded all of the nodes to run version 12.0.00.0725.0. Obviously when we started to see the performance hits we figured it was a no brainer to do this first but unfortunately we're still not seeing an improvement in performance.
I don't have any scientific monitoring results as yet. I've checked the IOPS value shown in the CMC at various times, including in the middle of a backup and even then the maximum IOPS shown was around the 2,000 mark and this is clearly much less than should be possible by the system. But I don't know if that points to a problem with the cluster configuration or something in vmWare.
The ten nodes we have are all only running 2 x 1gbit interfaces and we have 3 x ESX hosts connected to these. The 3 x ESX hosts each have a total of 8 network interfaces running at 1gbit each. These are then split into 3 x data network, 3 x storage traffic and 2 x vmotion. One thing that I will try is to reconfigure this mixture so we have 4 allocated to the storage traffic, just to see if that helps with performance at all.
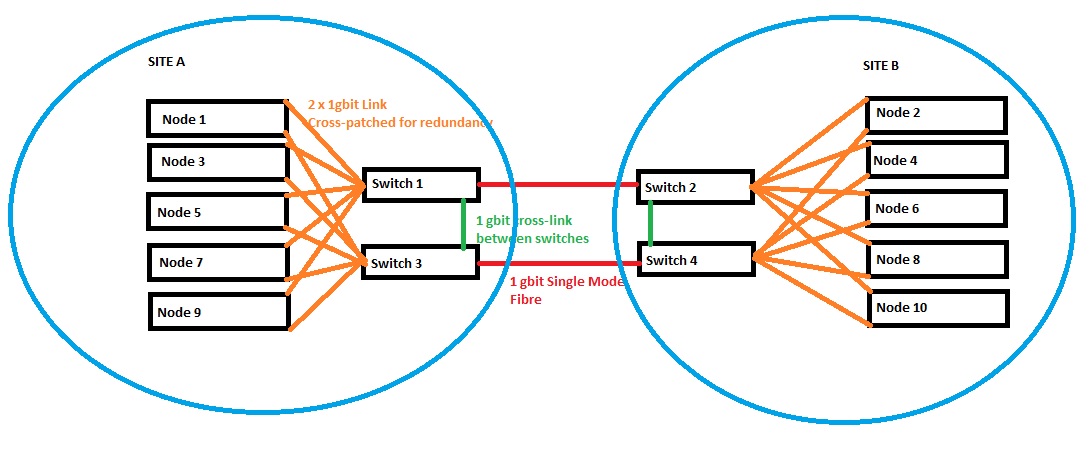
In order to provide redundancy we have 2 x 1 gigabit switches at each of the two sites where we have storage nodes located. We also have 2 x 1 gigabit connections from Site A to Site B in order to provide redundancy. The setup looks like this:
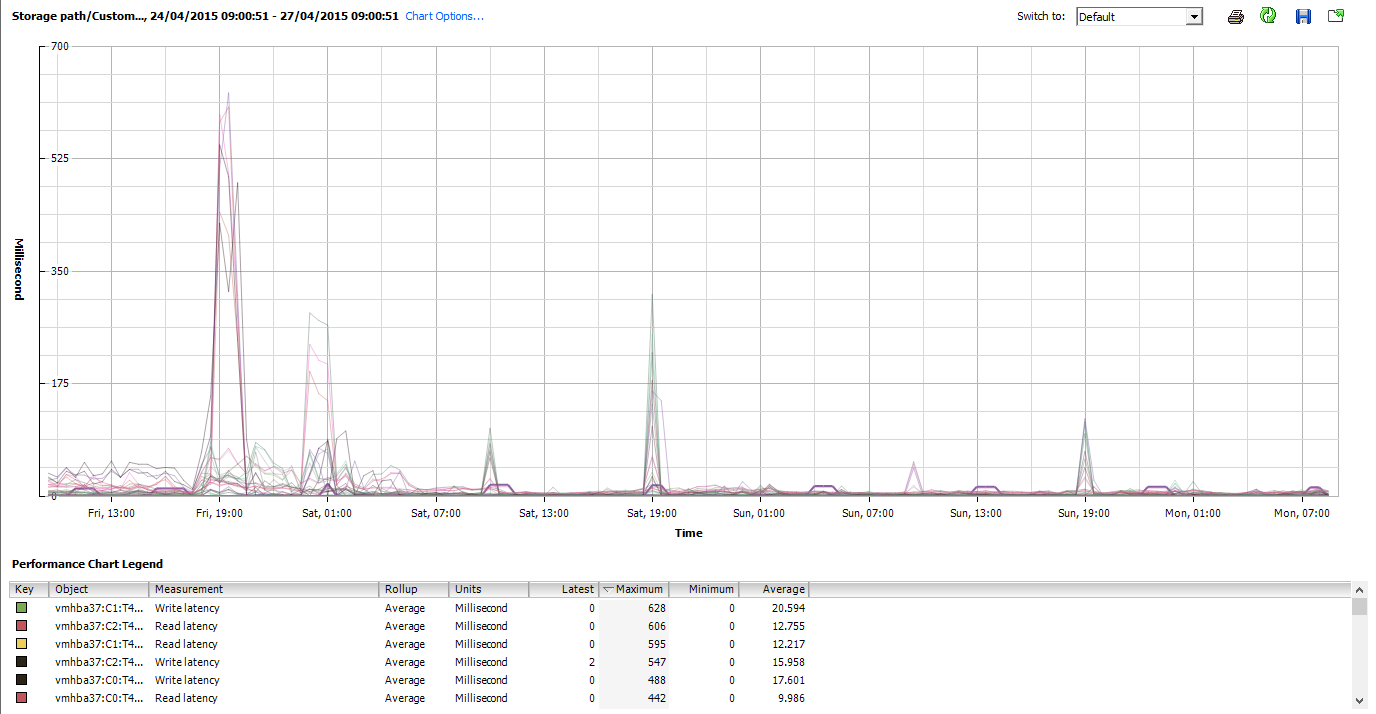
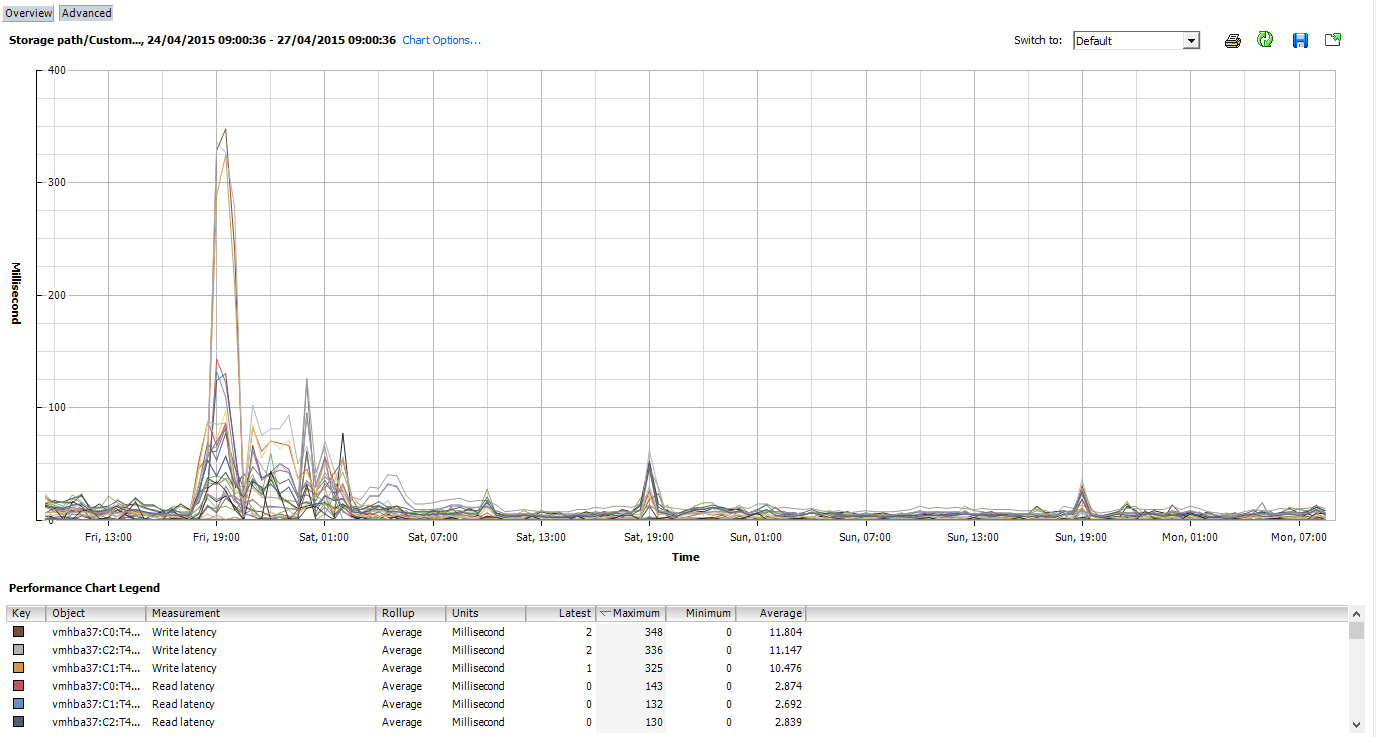
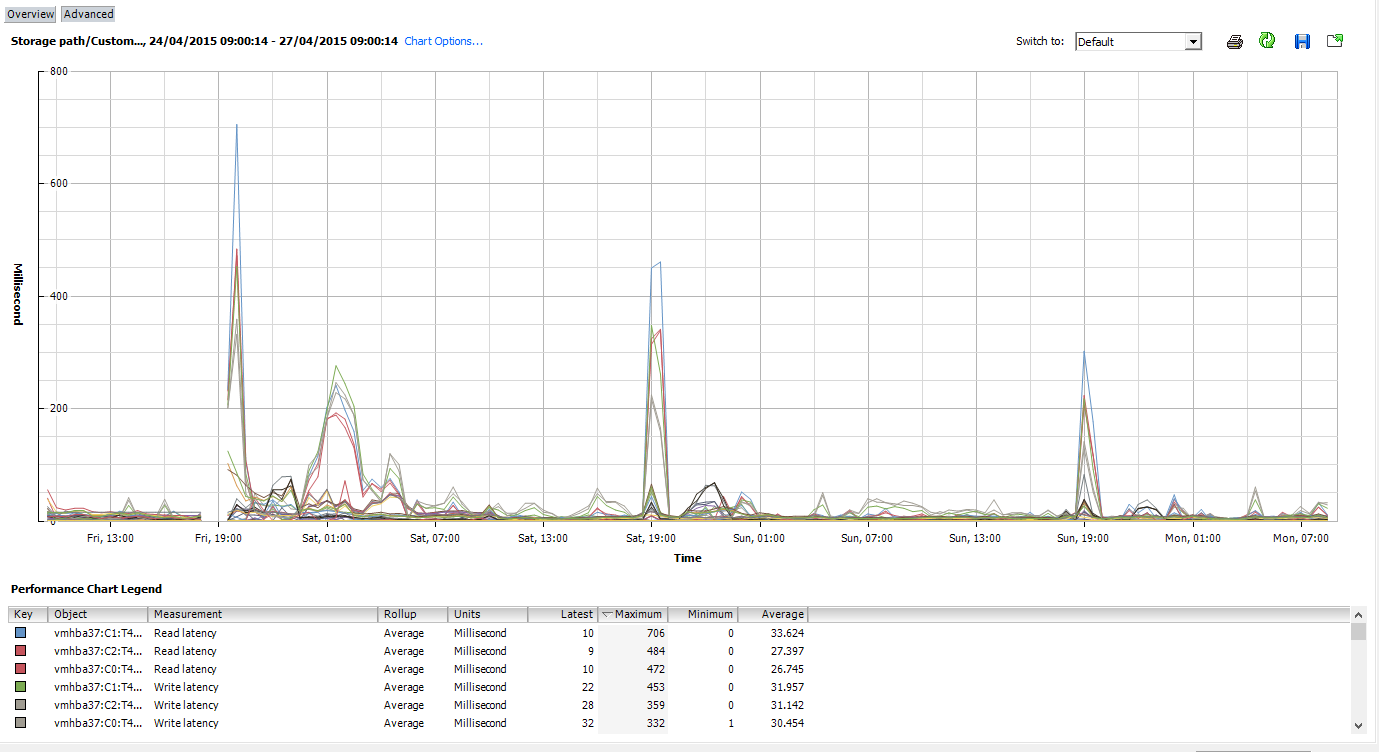
We actually had a major issue on Friday night at around 19:00 and this is when the CommVault backup is due to start. The performance on the storage was so bad that we had some major issues with systems totally stalling. This is what we see in vCenter for each of the three hosts. The performance view below shows from 09:00 on Friday morning through to 09:00 today.
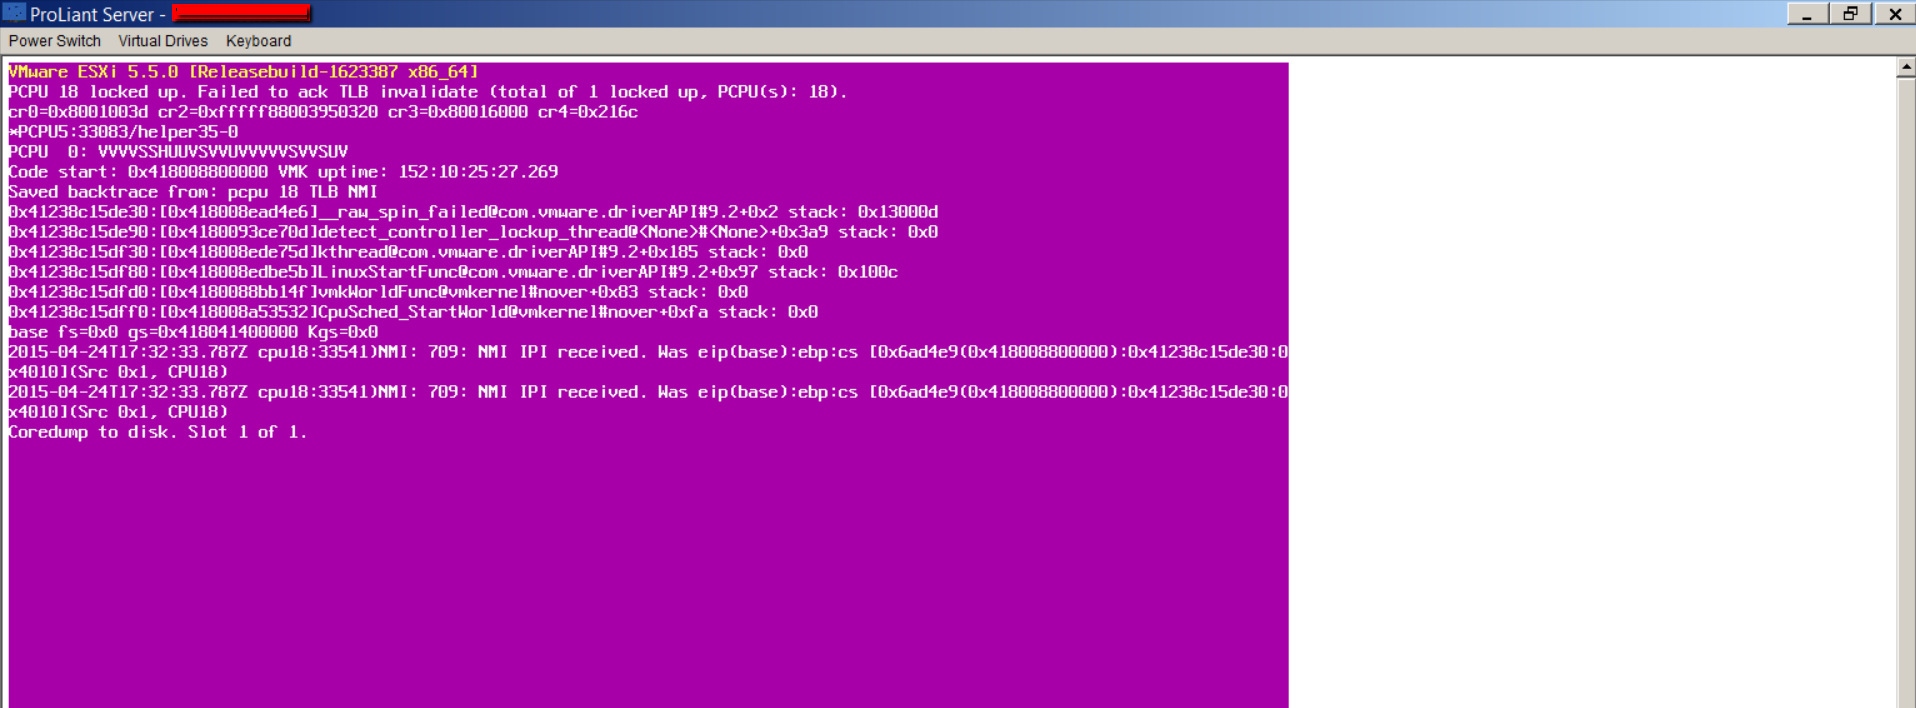
The last chart has a break in it. This was when the lovely VM host decided to do a 'pink screen of death'. It doesn't happen very often but in this case i'd say the problem certainly related to storage issues.
I will set the CMC up to do an export at 5 second intervals for a longer period of time so we can see what the stats from that show over a more sustained period.
Regards
Pete
- Mark as New
- Bookmark
- Subscribe
- Mute
- Subscribe to RSS Feed
- Permalink
- Report Inappropriate Content
04-28-2015 07:35 AM
04-28-2015 07:35 AM
Re: Very poor performance on our 10 node Lefthand Cluster
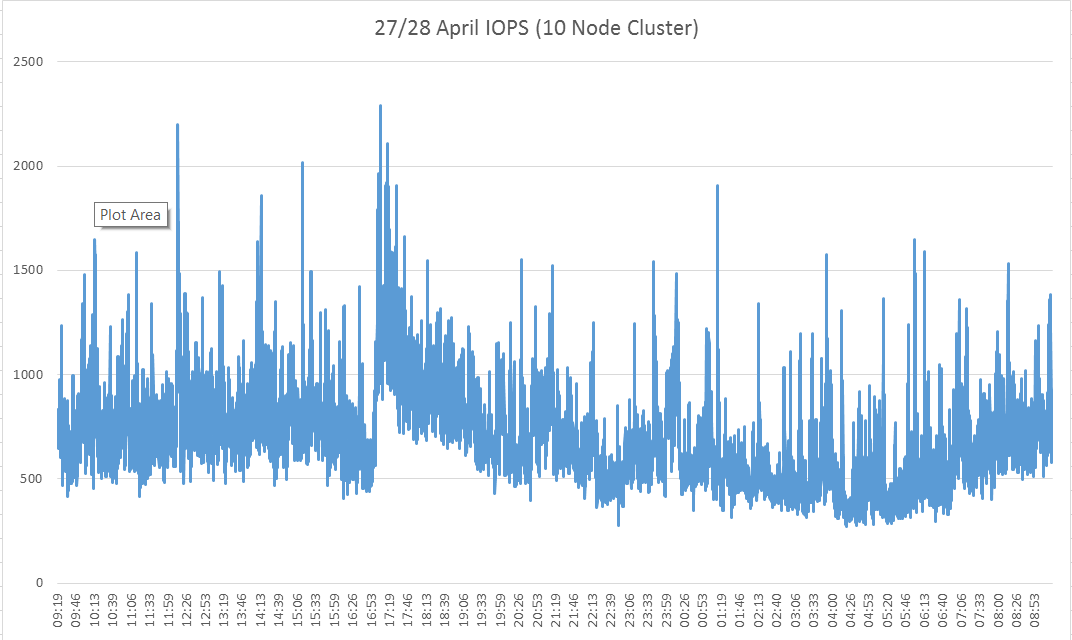
I measured and exported the stats for 24 hours and this is what we see. IOPS are well below what i'd expect to see. So clearly we have a bottle-neck somewhere.
- Mark as New
- Bookmark
- Subscribe
- Mute
- Subscribe to RSS Feed
- Permalink
- Report Inappropriate Content
04-28-2015 11:39 AM
04-28-2015 11:39 AM
Re: Very poor performance on our 10 node Lefthand Cluster
Hi Peter,
We run a similar multi-site setup with 6 nodes (2 of them 4350) running SANIQ 10.5.
Also 3 esx host connected to each site with 8 network ports (2x lan - 2x vmotion - 4 iscsi) and are connected through 4x 2920 switches stacked as virtual cluster.
We use virtual iscsi driver in vmware and not the hardware broadcom isci adaptor.
I am interested in your network config as I suspect the underlying issue on the network part.
(unless your cluster might be rebuilding ...)
We have setup our multisite like this:
- network alb bond
- flow control enabled
- jumbo frames enabled- 9000
Same for the switch config and vsphere iSCSI config (jumbo frames and flow control)
Btw our HP4350 nodes are connected with 4x1GB.
I had a problem once with a defect 4port network card where one port would autonegotiate to 10mbit! No alarms received because the link was still active but it's a pain to find out the issue.
But what I suspect to be the issue here, are the interconnects and links between your 4 switches.
The 1GBit connection will be saturated quickly by day to day operations and sync between the nodes.
If you do 2 vMotions you can have issues already. (if this happens check if spanning-tree doesn't kick in because if it does you'll get downtime)
Port buffer size is also important if you activate jumbo frames on the switches so don't underscale your switch setup.
To compare with our setup we have 10Gbit copper cable between the switches at each side and those stacked switches are connected with 2x 10Gbit fiber.
We average around 120mb/s with spikes over 200mb/s and the IO/s on the cluster on average are between 2000-3000 IOPS with spikes around 7000 IOPS.
What kind of switches are you using?
I hope this helps you a bit in finding your issue and if not I suggest contacting HP support.
Cheers.
- Mark as New
- Bookmark
- Subscribe
- Mute
- Subscribe to RSS Feed
- Permalink
- Report Inappropriate Content
04-28-2015 10:42 PM
04-28-2015 10:42 PM
Re: Very poor performance on our 10 node Lefthand Cluster
You could try to ensure, all network ports & paths are working on expected speed & giveing expected throughput performance. Though one nic card show 1Gbps, it can give very slow performance if flow control from storage port/ switch port is off !!!! . Iperf is the utility default available on Lefthand storages & the utility is available to download for windows
Run below tests:-
* throughput test between all storage nodes
* throughput perf between all ESX servers & storage nodes.
Hope this will help you.
Here's how I gathered my stats: Putty on using ssh to port 16022 to two nodes, login with Management Group credentials,
decide which will be the server for the test and which the client and run these commands:
On the server (or node-1):
CLIQ>utility run="iperf -s login=[IP of server NSM] -P 0 -i 5"
(say yes to confirmation to run the command when prompted)
utility run="iperf -s login=172.17.70.56 -P 0 -i 5"
On the client (or node-2):
CLIQ>utility run="iperf -c [IP of NSM above] -t 60 -i 5 -m 164"
(say yes to confirmation to run the command when prompted)
After 60 seconds the client will report the average throughput as the last line.
========================================================================================
CLIQ>utility run="iperf -s login=172.17.70.56 -P 0 -i 5"
HP StoreVirtual LeftHand OS Command Line Interface, v11.0.00.1263
(C) Copyright 2007-2013 Hewlett-Packard Development Company, L.P.
This command is recommended for HP support only.
Are You Sure (y/n)? y
RESPONSE
result 0
processingTime 77
name CliqSuccess
description Operation succeeded.
UTILITY
result 0
exitCode 0
===============================================================================================
CLIQ>utility run="iperf -c 172.17.70.57 -t 60 -i 5 -m 164"
HP StoreVirtual LeftHand OS Command Line Interface, v11.0.00.1263
(C) Copyright 2007-2013 Hewlett-Packard Development Company, L.P.
This command is recommended for HP support only.
Are You Sure (y/n)? y
RESPONSE
result 0
processingTime 60124
name CliqSuccess
description Operation succeeded.
UTILITY
result 0
exitCode 0
/etc/lefthand/bin/iperf: ignoring extra argument -- 164
------------------------------------------------------------
Client connecting to 192.168.215.128, TCP port 5001
TCP window size: 64.0 KByte (default)
------------------------------------------------------------
[ 3] local 192.168.215.131 port 48169 connected with 192.168.215.128 port 5001
[ 3] 0.0- 5.0 sec 1.23 GBytes 2.11 Gbits/sec
[ 3] 5.0-10.0 sec 1.07 GBytes 1.84 Gbits/sec
[ 3] 10.0-15.0 sec 672 MBytes 1.13 Gbits/sec
[ 3] 15.0-20.0 sec 659 MBytes 1.11 Gbits/sec
[ 3] 20.0-25.0 sec 597 MBytes 1.00 Gbits/sec
[ 3] 25.0-30.0 sec 632 MBytes 1.06 Gbits/sec
[ 3] 30.0-35.0 sec 675 MBytes 1.13 Gbits/sec
[ 3] 35.0-40.0 sec 661 MBytes 1.11 Gbits/sec
[ 3] 40.0-45.0 sec 614 MBytes 1.03 Gbits/sec
[ 3] 45.0-50.0 sec 738 MBytes 1.24 Gbits/sec
[ 3] 50.0-55.0 sec 738 MBytes 1.24 Gbits/sec
[ 3] 55.0-60.0 sec 643 MBytes 1.08 Gbits/sec
[ 3] 0.0-60.1 sec 8.77 GBytes 1.25 Gbits/sec
[ 3] MSS size 1448 bytes (MTU 1500 bytes, ethernet)
- Mark as New
- Bookmark
- Subscribe
- Mute
- Subscribe to RSS Feed
- Permalink
- Report Inappropriate Content
04-29-2015 06:03 AM
04-29-2015 06:03 AM
Re: Very poor performance on our 10 node Lefthand Cluster
Thanks to both PrasanthVA and Aart Kenens for their valuable assistance.
It is absolutely possible that the network configuration is actually at the center of the problem. Unfortunately this is one area where my knowledge really lets me down.
The guidance from PrasanthVA about how to do monitoring between the nodes is especially helpful as it immediately means we can discount the vmWare configuration. It was really the 'missing link' that I needed to start getting down to the root of the problem.
I can tell you that I started by doing a speed test between Nodes #1 and #2 which are actually sat right next to each other. This is the results. The numbers don't look great:
RESPONSE
result 0
processingTime 60125
name CliqSuccess
description Operation succeeded.
UTILITY
result 0
exitCode 0
/etc/lefthand/bin/iperf: ignoring extra argument -- 164
------------------------------------------------------------
Client connecting to xx.xx.xx.xxx, TCP port 5001
TCP window size: 64.0 KByte (default)
------------------------------------------------------------
[ 3] local xx.xx.xx.xxx port 48229 connected with yy.yy.yy.yyy port 5001
[ 3] 0.0- 5.0 sec 149 MBytes 250 Mbits/sec
[ 3] 5.0-10.0 sec 212 MBytes 355 Mbits/sec
[ 3] 10.0-15.0 sec 164 MBytes 276 Mbits/sec
[ 3] 15.0-20.0 sec 115 MBytes 192 Mbits/sec
[ 3] 20.0-25.0 sec 189 MBytes 318 Mbits/sec
[ 3] 25.0-30.0 sec 214 MBytes 359 Mbits/sec
[ 3] 30.0-35.0 sec 335 MBytes 563 Mbits/sec
[ 3] 35.0-40.0 sec 547 MBytes 917 Mbits/sec
[ 3] 40.0-45.0 sec 548 MBytes 920 Mbits/sec
[ 3] 45.0-50.0 sec 547 MBytes 917 Mbits/sec
[ 3] 50.0-55.0 sec 542 MBytes 909 Mbits/sec
[ 3] 55.0-60.0 sec 550 MBytes 923 Mbits/sec
[ 3] 0.0-60.0 sec 4.01 GBytes 575 Mbits/sec
[ 3] MSS size 1448 bytes (MTU 1500 bytes, ethernet)
This made me dig back into the configuration again and I noticed that the flow-control was not enabled on the ALB bond. I am totally sure that this was set in the past and when I check my switch configuration I can see that all of the required ports are set to 1000gbit, full duplex with flow-control enabled. It looks like at some point in the past the setting has dropped off. Perhaps this could explain the bad performance?
However, it isn't quite that simple. No matter what I do I cannot re-enable flow control on that ALB bond. I even tried breaking the bond, disabling one of the NIC's and then just enabling flow-control on one interface. When I do that it still shows as 'Receive: Off, Transmit: Off' despite me trying to manually configure it and also ensureing the switch config is right.
Here are the details on the network setup.
At this site: 2 x 3COM 4210G Switches
Remote Site: 2 x 3COM 4210G Switches
Lefthand Node #1 is connected like this:
Port1 - Switch 1 - Port 13
Port 2- Switch 2 - Port 13
Port Config for the NIC #1 on LeftHand Node #1:
NIC #2 on LeftHand Node #1 is currently disabled
When you look in the CMC it shows this:
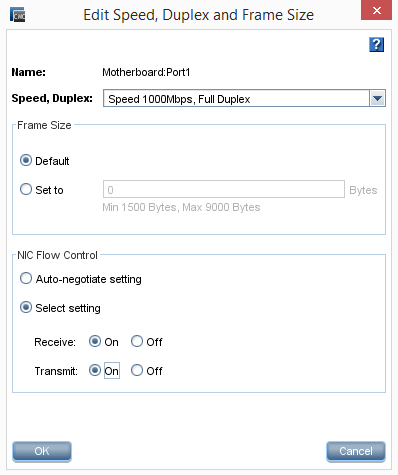
So you edit the Port 1 configuration to this:
Click OK to accept the setting. It loses connectivity to the node and when you get reconnected the settings are back to flow control disabled.
I have no idea what's going on here but if anyone has any clues on this or how to find out why it's not working then i'd appreciate it.
I realise Jumbo Frames will also improve performance but I think the first stage is just getting flow control back on again.
- Mark as New
- Bookmark
- Subscribe
- Mute
- Subscribe to RSS Feed
- Permalink
- Report Inappropriate Content
04-29-2015 08:59 AM
04-29-2015 08:59 AM
Re: Very poor performance on our 10 node Lefthand Cluster
It would seem that getting network flow control to be enabled is an art form in itself.
I've tried all things to get it working and none of them have worked. I even went so far as breaking the ALB bond and then setting IP's on both interfaces. I then manually specified 1000gbit/full with flow control enabled. A few reboots later and I actually got one of the storage nodes to show both interfaces with the right configuration.
Then I added the ALB Bond and sure enough flow control got turned off.
This is a nightmare. It seems there is no other way to configure flow control either than using the CMC.
Any more tips on this one?
- Mark as New
- Bookmark
- Subscribe
- Mute
- Subscribe to RSS Feed
- Permalink
- Report Inappropriate Content
04-29-2015 12:34 PM
04-29-2015 12:34 PM
Re: Very poor performance on our 10 node Lefthand Cluster
Hi Peter,
There are various whitepapers on how to setup the network bond.
Designing best practice iSCSI solutions start with ensuring resilient network communication and traffic distribution. Storage nodes are designed to address network fault tolerance and bandwidth aggregation by bonding network interfaces. Depending on storage system hardware, network infrastructure design, and Ethernet switch capabilities, network interfaces can be configured to support one of three bonded techniques. As changing the default speed, duplex, and flow control settings of interfaces can only be performed on interfaces that are not bonded, these settings should be configured prior to bonding network interface. Network interfaces are bonded by joining two or more physical interfaces into a single logical interface (a so-called bond) with one IP address. The logical interface utilizes two or more physical interfaces. A bond is primarily used to increase fault tolerance at the network level, thus tolerating the failure of a network adapter, cable, switch port, and or a single switch in some cases. Bandwidth aggregation is another reason to create bonds. Bonds may be used for cluster and iSCSI connectivity, as well as management traffic; for example, on HP StoreVirtual 4330 Storage with four 1GbE ports: Two interfaces in one bond for inter-node cluster/iSCSI communication and two interfaces in another bond for CMC management operations on a different network segment.
http://h20195.www2.hp.com/v2/getpdf.aspx/4aa2-5615enw.pdf
Actually it's not so hard but the problem you have that you're running a live environment.
I suggest to plan some downtime and setup everything according best practice (jumbo frames,flow control, alb bond).
If you don't feel up to the task then search a firm who can do it for you. Shouldn't take long to fix...
I also checked those 3com switches 4210G and those are not designed for such environment with jumbo frames as the port buffer size per port is to low.
This will hurt your sequential performance very hard.
To compare your 3com switches with our HP 2920 switches.
3Com switch
Broadcom 5836 @ 264 MHz, 16 MB flash, 64 MB RAM; packet buffer size: 1.5 MB
HP 2920
Tri Core ARM1176 @ 625 MHz, 512 MB SDRAM, 1 GB flash; packet buffer size: 11.25 MB (6.5 MB dynamic egress + 4.5 MB ingress)
I think this might the first step to start with, replace your switches by decent switches for iSCSI traffic.
Aart
- Mark as New
- Bookmark
- Subscribe
- Mute
- Subscribe to RSS Feed
- Permalink
- Report Inappropriate Content
04-29-2015 12:45 PM
04-29-2015 12:45 PM
Re: Very poor performance on our 10 node Lefthand Cluster
Thanks Aart.
Our vendor is going to have some talking to do then - because it was they that actually recommended those switches for the job. But granted at that point we had a smaller setup so maybe at that point they were suitable.
The problem we have is that downtown is extremely hard for us to have - our site is 24x7 and shutting down any of the major systems is difficult, never mind shutting them all down.
I presume that one option would be to buy 4 x new switches of a better spec (as you mention) and ensure that they have an uplink to the original switches. We could then, in theory, move from the old switches to the new in a phased manner?
Doing it this way we should, for example, see a performance increase when measing traffic between Node 1 and Node 2, once both of those nodes are on the new switching gear?
What's more confusing to me is why flow control dropped off. It was all working fine and my gut feeling is that the flow control change coincided with the upgrade to SanIQ v11. I was told this was a mandatory update which WOULD be needed to allow the existing P4500 G2 nodes to exist with the new StoreVirtual nodes.
I'll have a read through the white papers and see if they provide any assistance. At the very least i'd expect it to be possible to enable flow-control on the nodes and right now even that seems impossible. To put it another way - flow control WAS working before the system went into production and i'm a little unhappy that the setting seems to have dropped away during the life cycle of the storage.
Thanks for your help so far though - it is massively appreciated and I do feel we're making at least some progress. :-)

