
- Community Home
- >
- Networking
- >
- IMC
- >
- IMC / No data found
Categories
Company
Local Language
Forums
Discussions
Forums
- Data Protection and Retention
- Entry Storage Systems
- Legacy
- Midrange and Enterprise Storage
- Storage Networking
- HPE Nimble Storage
Discussions
Discussions
Discussions
Forums
Discussions
Discussion Boards
Discussion Boards
Discussion Boards
Discussion Boards
- BladeSystem Infrastructure and Application Solutions
- Appliance Servers
- Alpha Servers
- BackOffice Products
- Internet Products
- HPE 9000 and HPE e3000 Servers
- Networking
- Netservers
- Secure OS Software for Linux
- Server Management (Insight Manager 7)
- Windows Server 2003
- Operating System - Tru64 Unix
- ProLiant Deployment and Provisioning
- Linux-Based Community / Regional
- Microsoft System Center Integration
Discussion Boards
Discussion Boards
Discussion Boards
Discussion Boards
Discussion Boards
Discussion Boards
Discussion Boards
Discussion Boards
Discussion Boards
Discussion Boards
Discussion Boards
Discussion Boards
Discussion Boards
Discussion Boards
Discussion Boards
Discussion Boards
Discussion Boards
Discussion Boards
Discussion Boards
Community
Resources
Forums
Blogs
- Subscribe to RSS Feed
- Mark Topic as New
- Mark Topic as Read
- Float this Topic for Current User
- Bookmark
- Subscribe
- Printer Friendly Page
- Mark as New
- Bookmark
- Subscribe
- Mute
- Subscribe to RSS Feed
- Permalink
- Report Inappropriate Content
02-04-2020 12:00 AM
- Mark as New
- Bookmark
- Subscribe
- Mute
- Subscribe to RSS Feed
- Permalink
- Report Inappropriate Content
02-07-2020 09:10 AM
02-07-2020 09:10 AM
Re: IMC / No data found
Hello,
What vendor and model of devices are you trying to monitor with iMC?
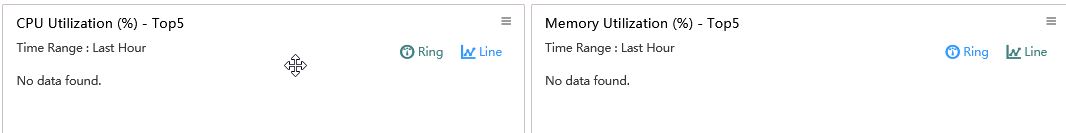
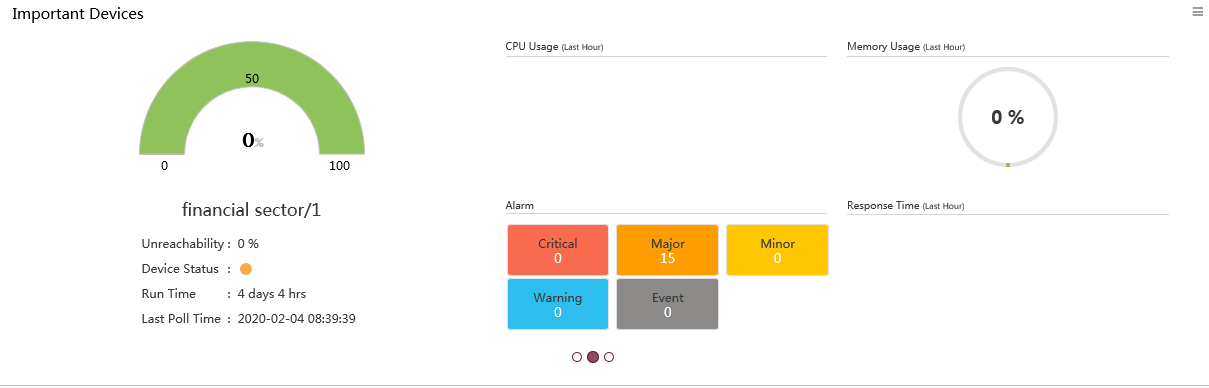
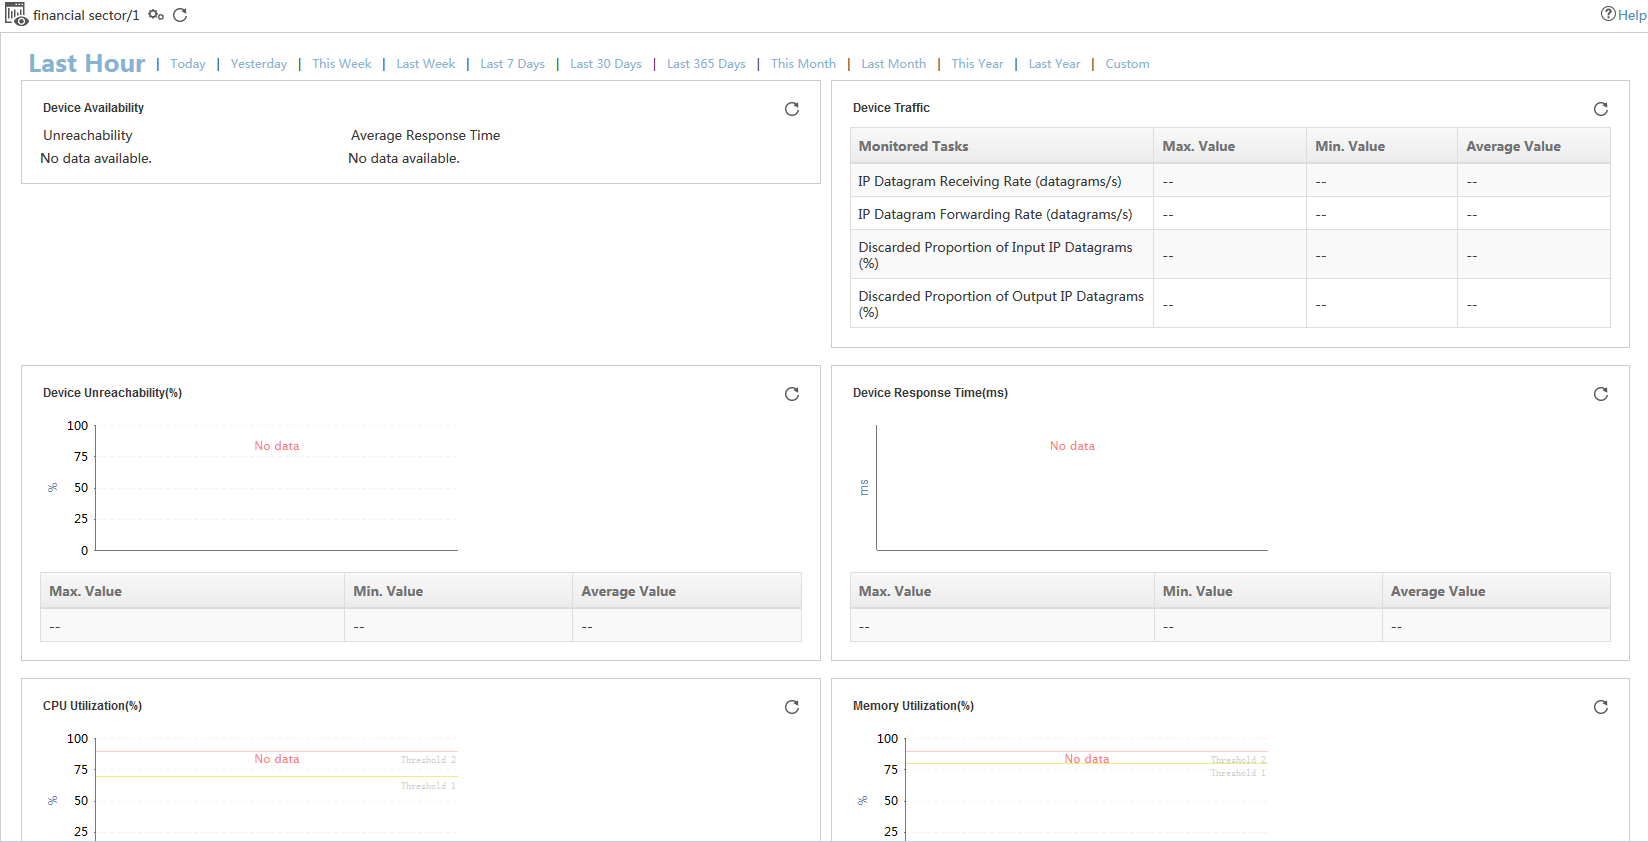
If you don't see any data on these default Performance Monitoring (CPU/Memory) graphs, that means iMC is unable to poll the SNMP OIDs associated with those performance monitors - hence it can't get any data to display on the graphs. This is most likely a general issue with SNMP being misconfigured or inaccessible on the device - check your SNMP Settings in iMC and ensure they match on the device.
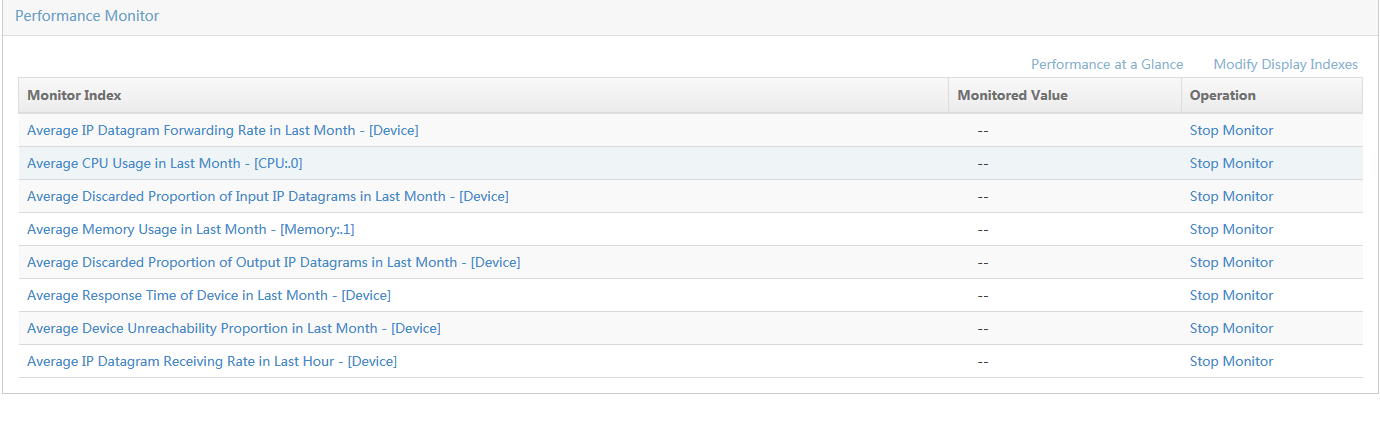
The CPU/Memory performance monitors get added on devices where they can be polled by default when you add them to iMC, but won't just get re-added automatically if you fix the SNMP settings at some later point in time. To add them, you could either delete and re-add the device(s) to iMC, or go to Service > Performance Management > Monitoring Settings and add them there via "Add Monitor" if you don't want to re-add the device.
Further details about this can be found in the iMC Administrator Guide (Performance Management section) - https://support.hpe.com/hpesc/public/docDisplay?docLocale=en_US&docId=c05367532
Justin
Working @ HPE

- Mark as New
- Bookmark
- Subscribe
- Mute
- Subscribe to RSS Feed
- Permalink
- Report Inappropriate Content
02-12-2020 11:16 PM - last edited on 02-18-2020 06:56 AM by Parvez_Admin
02-12-2020 11:16 PM - last edited on 02-18-2020 06:56 AM by Parvez_Admin
Re: IMC / No data found
Great article, but it would be nice if you added an example with navigation.
- Mark as New
- Bookmark
- Subscribe
- Mute
- Subscribe to RSS Feed
- Permalink
- Report Inappropriate Content
02-20-2020 04:11 AM
02-20-2020 04:11 AM
Re: IMC / No data found
Hello,
If you are referring to an example of adding back CPU/Memory monitoring, I'll provide an overview below. It's the same process to add any monitoring instances to any device(s).
- Open Resource > Performance Management > Monitoring Settings
- Check the box next to device(s) where you want to add monitoring, and click on Add Monitor
- In the pop-up window, click on Add in the Select Index area. This opens another pop-up where you can select which monitors to add to your device(s).
- Check the box for CPU Usage and Memory Usage in this instance, and click OK. The indexes (CPU & Memory) will now be listed in the Select Index area.
- Click OK, and iMC will add the monitoring to the selected devices. The Instance List window that appears will show you whether they were successfully applied or not.
If they are NOT successfully added, this could be caused by SNMP communication not working properly - usually a v1/v2 community string mismatch or v3 parameter mismatch between iMC and the device, or an ACL/Firewall blocking SNMP, or some other SNMP communication issue. It's also possible the device does not support the SNMP OIDs used to retrieve the values used by the index.
You can see which OIDs are being used by iMC by running a packet capture on the iMC server and applying a filter for relevant packets, like "snmp and ip.addr eq target-ip" (replace target-ip with the actual ip address of your device) in Wireshark. If the device responds to the OID(s) with "NoSuchObject" instead of a value it tends to mean the device does not support that OID.
Justin
Working @ HPE