
- Community Home
- >
- Servers and Operating Systems
- >
- Operating Systems
- >
- Operating System - Linux
- >
- Re: query on top and mount command
Categories
Company
Local Language
Forums
Discussions
Forums
- Data Protection and Retention
- Entry Storage Systems
- Legacy
- Midrange and Enterprise Storage
- Storage Networking
- HPE Nimble Storage
Discussions
Discussions
Discussions
Forums
Discussions
Discussion Boards
Discussion Boards
Discussion Boards
Discussion Boards
- BladeSystem Infrastructure and Application Solutions
- Appliance Servers
- Alpha Servers
- BackOffice Products
- Internet Products
- HPE 9000 and HPE e3000 Servers
- Networking
- Netservers
- Secure OS Software for Linux
- Server Management (Insight Manager 7)
- Windows Server 2003
- Operating System - Tru64 Unix
- ProLiant Deployment and Provisioning
- Linux-Based Community / Regional
- Microsoft System Center Integration
Discussion Boards
Discussion Boards
Discussion Boards
Discussion Boards
Discussion Boards
Discussion Boards
Discussion Boards
Discussion Boards
Discussion Boards
Discussion Boards
Discussion Boards
Discussion Boards
Discussion Boards
Discussion Boards
Discussion Boards
Discussion Boards
Discussion Boards
Discussion Boards
Discussion Boards
Community
Resources
Forums
Blogs
- Subscribe to RSS Feed
- Mark Topic as New
- Mark Topic as Read
- Float this Topic for Current User
- Bookmark
- Subscribe
- Printer Friendly Page
- Mark as New
- Bookmark
- Subscribe
- Mute
- Subscribe to RSS Feed
- Permalink
- Report Inappropriate Content
07-19-2010 11:45 AM
07-19-2010 11:45 AM
below is a screenshot which shows node1 on the left and node 2 on the right.
http://img836.imageshack.us/img836/7519/topmount.jpg
storage is eva 4400
the screenshot is taken a little after production hrs. from the output of the top command do u think the memory is getting swapped a lot and we should increase the memory or go for an additional RAC node.
further the output of the mount command shows, that all the mountpoints are block devices and not LVMs. Would it be better if they were LVMs instead of simple block devices formatted as ext3 and OCFS2, as LVMs would mean we can resize them dynamically?
Solved! Go to Solution.
- Mark as New
- Bookmark
- Subscribe
- Mute
- Subscribe to RSS Feed
- Permalink
- Report Inappropriate Content
07-19-2010 12:35 PM
07-19-2010 12:35 PM
Re: query on top and mount command
For the operating system, probably it's good idea to use LVM, but hard to change at this time.
You cannot use OCFS2 with LVM without a cluster software that provides a Clusterized LVM.
- Mark as New
- Bookmark
- Subscribe
- Mute
- Subscribe to RSS Feed
- Permalink
- Report Inappropriate Content
07-19-2010 09:20 PM
07-19-2010 09:20 PM
Re: query on top and mount command
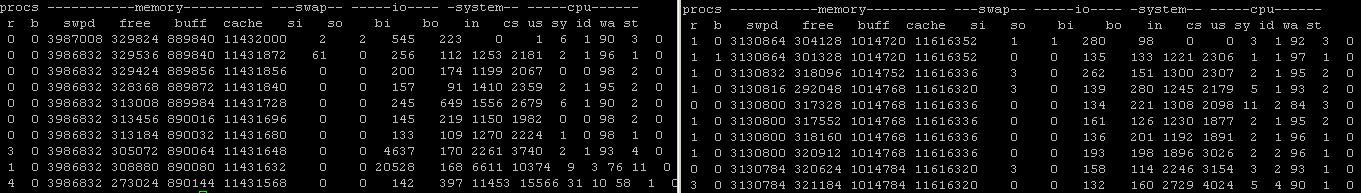
i v attached a vmstat command screenshot on both nodes. i am reading some docs online to understand it. can you also plz throw more light on it?
- Mark as New
- Bookmark
- Subscribe
- Mute
- Subscribe to RSS Feed
- Permalink
- Report Inappropriate Content
07-19-2010 10:53 PM
07-19-2010 10:53 PM
Re: query on top and mount command
vmstat 5 10
does this help in deciphering anything? i m still a noob :(
- Mark as New
- Bookmark
- Subscribe
- Mute
- Subscribe to RSS Feed
- Permalink
- Report Inappropriate Content
07-20-2010 01:49 AM
07-20-2010 01:49 AM
SolutionYou seem to be using Oracle ASM (oracleasmfs in your mount listings), which implies some data may be stored on ASM-controlled raw disk devices, and not at all visible as filesystems.
During the time you ran the last vmstat, the "so" column was mostly zeroes = no page-out activity. The two non-zero values were 1 and 2 = very very minor page-out activity.
The "si" column includes things other than swapping/paging (e.g. reading a memory-mapped file), so it's less useful. But that column is also mostly zeroes.
The percentage numbers in the "cpu" group indicate the system is mostly idle: the "id" column is almost constantly over 90%. (Note that the column titles are shifted because of the large numbers in the "memory" group.) The values in the "wa" column are all very small, so the system is not spending significant time in waiting for other things (usually network or disk I/O) to happen.
Run vmstat over your entire production hours (or the busiest time, if you can determine it). Then import the output into a spreadsheet (Excel or equivalent) and have it draw some graphs for you.
Ideally, the "so" column should be mostly zeroes: small non-zero bumps are OK, huge spikes may be a problem. Long segments of non-zero "so" are usually symptoms of a shortage of RAM, even if the values are not so huge.
Graphing the columns of the "cpu" group could be useful too: "us" is userspace work, which is usually your "payload". "id" is idle time: if this goes very low when users are complaining about slowness, more CPUs might be helpful. If the "wa" column dominates the results at the times of peak workload, you might have an I/O bottleneck somewhere.
MK
- Mark as New
- Bookmark
- Subscribe
- Mute
- Subscribe to RSS Feed
- Permalink
- Report Inappropriate Content
07-20-2010 02:39 AM
07-20-2010 02:39 AM
Re: query on top and mount command
thanks a lot for your post. Just as you posted I finished reading and understanding some articles on the net to understand vmstat command and wat it does. your post always contains info more than what u can find under the sun.
:)
Just as I finished understanding the command, peak prod hours were over and my vmstat command resulted in full load of idle runs.
i will run it again tomorrow during prod hours (around 8 hrs).
so does it make sense to run the command like
user1@odbs1:~> vmstat 5 >> vmstat.txt &
user1@odbs2:~> vmstat 5 >> vmstat.txt &
and leave it running? it wont consume CPU or memory resources and affect the production servers! am i right?
and later i can kill the process vmstat?
- Mark as New
- Bookmark
- Subscribe
- Mute
- Subscribe to RSS Feed
- Permalink
- Report Inappropriate Content
07-20-2010 03:44 AM
07-20-2010 03:44 AM
Re: query on top and mount command
- Mark as New
- Bookmark
- Subscribe
- Mute
- Subscribe to RSS Feed
- Permalink
- Report Inappropriate Content
07-21-2010 07:31 AM
07-21-2010 07:31 AM
Re: query on top and mount command
i find that majority of the si in both nodes of the oracle db are zero but off n on show figures ranging in the range of 50-140.
so is zero all through. so that means there is no read from the disk.
i find that in both nodes the memory free column shows free memory in the range of 300000-500000 which means there is 0.3-0.5 Gigs of free memory always.
during peak load the cpu > wa column continuously shows figures in the range of 50-90 for 20-30 minute periods on one node while its idle on the other RAC node.
the fact is that free memory on the system is always 300-500 mb during peak loads. is that strong enough a reason to increase the memory in the two nodes?