- Community Home
- >
- Storage
- >
- HPE SimpliVity
- >
- Simplivity performance metrics differ from other m...
Categories
Company
Local Language
Forums
Discussions
Forums
- Data Protection and Retention
- Entry Storage Systems
- Legacy
- Midrange and Enterprise Storage
- Storage Networking
- HPE Nimble Storage
Discussions
Forums
Discussions
Discussions
Discussions
Forums
Discussions
Discussion Boards
Discussion Boards
Discussion Boards
Discussion Boards
- BladeSystem Infrastructure and Application Solutions
- Appliance Servers
- Alpha Servers
- BackOffice Products
- Internet Products
- HPE 9000 and HPE e3000 Servers
- Networking
- Netservers
- Secure OS Software for Linux
- Server Management (Insight Manager 7)
- Windows Server 2003
- Operating System - Tru64 Unix
- ProLiant Deployment and Provisioning
- Linux-Based Community / Regional
- Microsoft System Center Integration
Discussion Boards
Discussion Boards
Discussion Boards
Discussion Boards
Discussion Boards
Discussion Boards
Discussion Boards
Discussion Boards
Discussion Boards
Discussion Boards
Discussion Boards
Discussion Boards
Discussion Boards
Discussion Boards
Discussion Boards
Discussion Boards
Discussion Boards
Discussion Boards
Discussion Boards
Discussion Boards
Community
Resources
Forums
Blogs
- Subscribe to RSS Feed
- Mark Topic as New
- Mark Topic as Read
- Float this Topic for Current User
- Bookmark
- Subscribe
- Printer Friendly Page
- Mark as New
- Bookmark
- Subscribe
- Mute
- Subscribe to RSS Feed
- Permalink
- Report Inappropriate Content
03-11-2021 02:48 AM
03-11-2021 02:48 AM
Simplivity performance metrics differ from other monitoring systems
Hello Everyone,
Im confused about the way how Simplivity measures perfomance.
Some weeks ago one of the VM did DB copy to another virtual disk in that same VM, write latency for all virtual disks were ~53,~52~106, read ~47~59~32 ms according to Veeam One but Simplivity only shows about 45ms write, 35ms read.
I understand it is due Simplivity capturing data every hour. If VM starts process at 10:30 and finishes at 11:30 doing those latencies all the time, it will show 45 and 35ms between at 11 due to averaging latency between whole hours. Is that true?
Other confusion I have is meanwhile first VM was going crazy local backup, according to Veeam One all other VM latencies were fine, up to 10ms. However when I check cluster performance and Open Top Contributors, one other VM shows up with 25ms reads, from what those reads are coming? When I open SVT performance counters for that VM individually (not from Top Contributors) at that time it was not doing reads at all, Veeam one also show that.
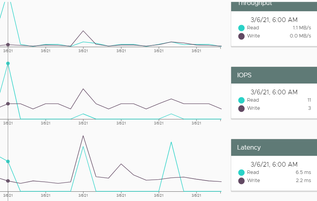
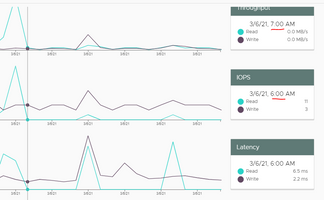
Why such indifferences? Also when scrolling zoomed performance data from weeks ago, charts are changing, however time stamps are not.
- Mark as New
- Bookmark
- Subscribe
- Mute
- Subscribe to RSS Feed
- Permalink
- Report Inappropriate Content
03-17-2021 07:38 AM
03-17-2021 07:38 AM
Re: Simplivity performance metrics differ from other monitoring systems
Hi @steez ,
Thank you for choosing HPE.
This query would require some detailed checks, hence would request you to log a SimpliVity support case with HPE and one of our support engineers should be able to advise accordingly on it.
regards,
Rajini Saini
I work for HPE

- Mark as New
- Bookmark
- Subscribe
- Mute
- Subscribe to RSS Feed
- Permalink
- Report Inappropriate Content
03-18-2021 09:39 AM - edited 03-18-2021 09:48 AM
03-18-2021 09:39 AM - edited 03-18-2021 09:48 AM
Re: Simplivity performance metrics differ from other monitoring systems
Hi @steez,
SimpliVity performance support engineer here. I work nearly exclusively on SimpliVity performance cases and can speak to these issues you're having.
To start, VEEAM measurement is done by reading the data that the OS file system has for response times as it requests I/O from the virtual disk. This layer is the top of the stack, whereas underneath the OS layer, there is the storage controller, the datastore and the underlying storage solution. The VM/OS layer starts a timer when their request goes to the virtual disk, the Datastore starts it's timer when it receives the request from the storage controller of the VM and begins the process of asking storage (in our case a I/O request through the NFS layer) and then we start out timer when we recieve the I/O request through the NFS protocol.
Therefore, the Response Time measured by SimpliVity is always going to be lower than what VEEAM reports because we start measuring the moment we receive the request and stop the moment we service it back through NFS to the datastore.
As for the discrepency in the GUI, it is possible for the GUI to show the wrong values if the plugin functionality is hampered for some reason. If, for example, the extension/plugin that we have installed on the vcenter isn't working perfectly, it's possible that when you go to the VM itself to see the data, the rest-api request isn't happening to the OVC for the data.
The best way I can describe this is that sometimes you may see an issue with the plugin where an option is missing on a VM (albeit this is a rare occurrence), or the SimpliVity menu is present, but has no options; this is very much the same. Sometimes a refresh of the plugin or restart of the vcenter server or its services could restart the equation.
There is a log file, the "Virgo log" that exists on the VCenter that could have useful information about plugin functionality.
There is also a rest api logs on the OVCs that can have detailed information. To find the rest log on any SimpliVity system:
find /var/ |grep -i rest-api.log
If the plugin is actually getting the REST API request out, its possible that the response is null/incomplete. You can test this functionality by using the REST API yourself. Navigate in a browser to the management address of an OVC in the cluster and click on the "reference" guide linked on that page. Click LOGIN at the top right and look at what is presented. This API is accessible to you and is powerful. You can even write code to pull information from the REST API and load it into a graphical front end for monitoring of the environment.
I would recommend opening a support case to rectify discrepencies in the graphical output in the SimpliVity plugin.
If you are experiencing a performance issue and need further analysis, I may be able to help you. The location of your asset and the service level you have will determine whether or not I can assist you, otherwise it would have to be through support in other regions.
I work for HPE

Regards,
Stephen Jamieson
Escalation and Performance Engineer III
North America & Latin America
Global Remote Services
hpe.com/pointnext

