- Community Home
- >
- Storage
- >
- Around the Storage Block
- >
- HPE Nimble Storage dHCI – Management
Categories
Company
Local Language
Forums
Discussions
Forums
- Data Protection and Retention
- Entry Storage Systems
- Legacy
- Midrange and Enterprise Storage
- Storage Networking
- HPE Nimble Storage
Discussions
Forums
Discussions
Discussions
Discussions
Forums
Discussions
Discussion Boards
Discussion Boards
Discussion Boards
Discussion Boards
- BladeSystem Infrastructure and Application Solutions
- Appliance Servers
- Alpha Servers
- BackOffice Products
- Internet Products
- HPE 9000 and HPE e3000 Servers
- Networking
- Netservers
- Secure OS Software for Linux
- Server Management (Insight Manager 7)
- Windows Server 2003
- Operating System - Tru64 Unix
- ProLiant Deployment and Provisioning
- Linux-Based Community / Regional
- Microsoft System Center Integration
Discussion Boards
Discussion Boards
Discussion Boards
Discussion Boards
Discussion Boards
Discussion Boards
Discussion Boards
Discussion Boards
Discussion Boards
Discussion Boards
Discussion Boards
Discussion Boards
Discussion Boards
Discussion Boards
Discussion Boards
Discussion Boards
Discussion Boards
Discussion Boards
Discussion Boards
Discussion Boards
Community
Resources
Forums
Blogs
- Subscribe to RSS Feed
- Mark as New
- Mark as Read
- Bookmark
- Receive email notifications
- Printer Friendly Page
- Report Inappropriate Content
HPE Nimble Storage dHCI – Management
Stack Manager is the management tool for HPE Nimble Storage dHCI. It’s implemented as a vCenter plugin and is automatically registered as part of the dHCI so no additional configuration or deployment required!
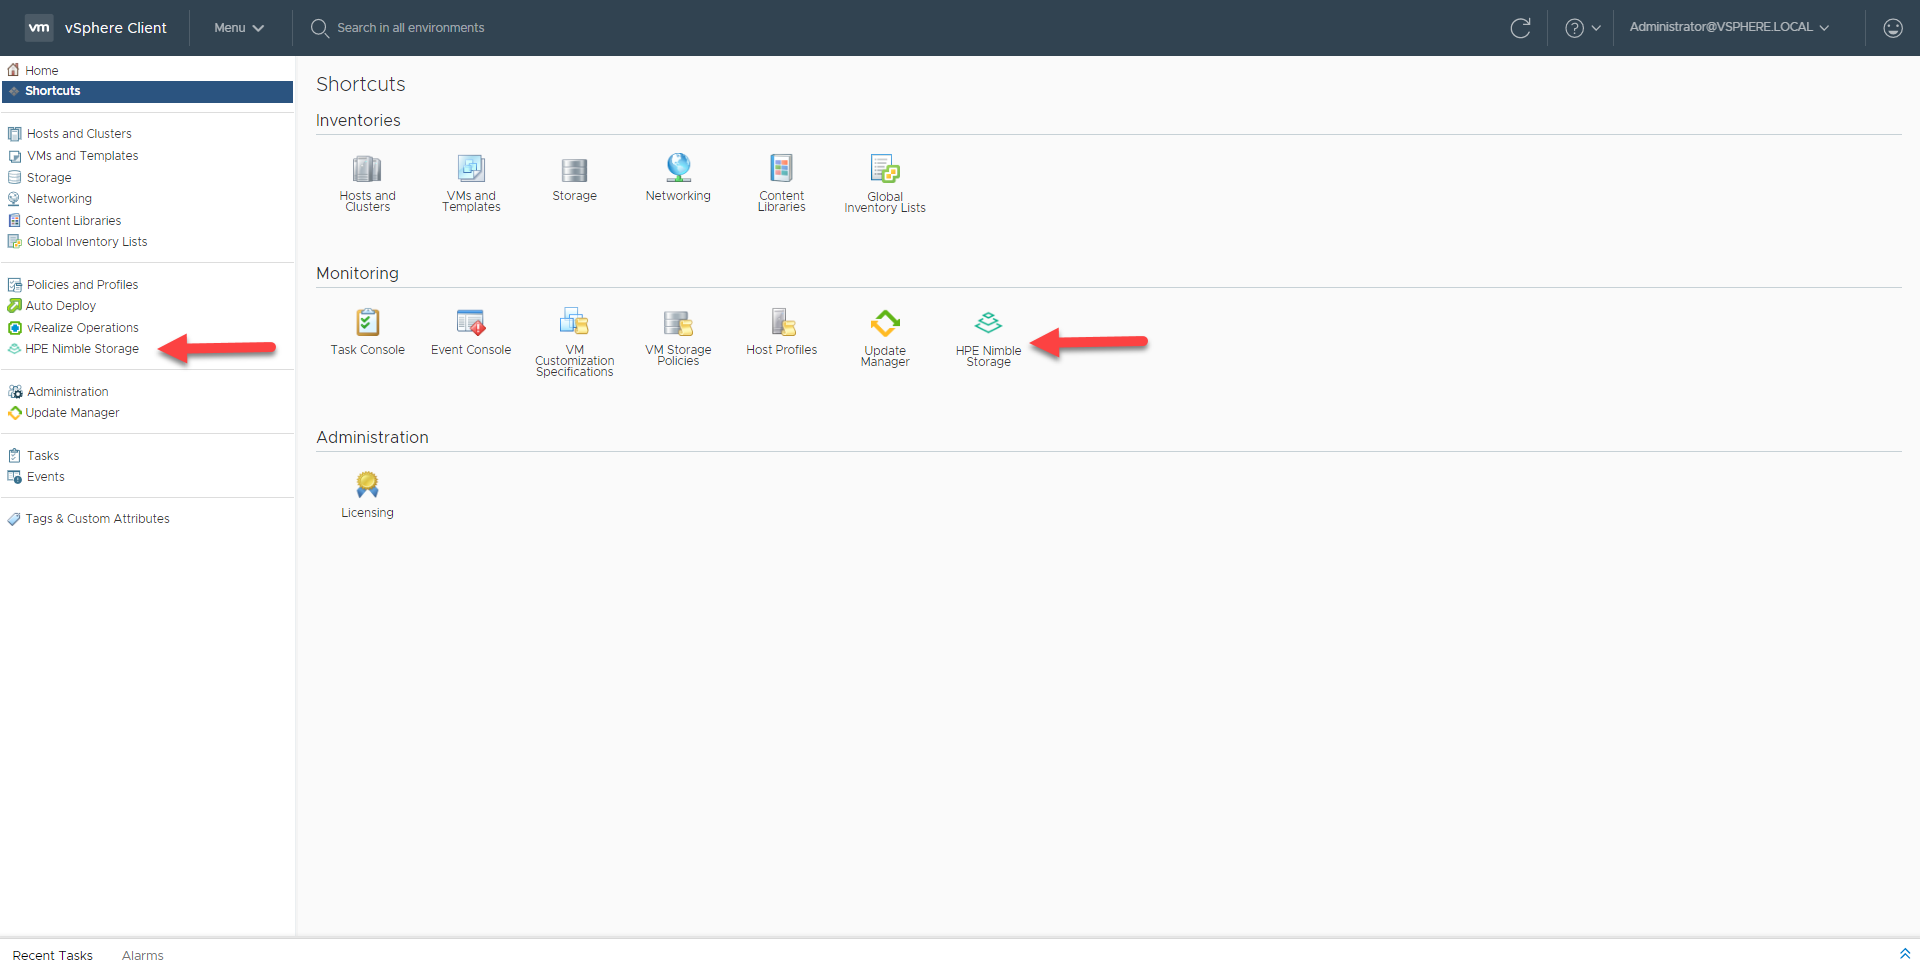
To access the plugin, open a web browser to your HTML5 web client. You should see something like this, with the HPE Nimble Storage plugin visible:
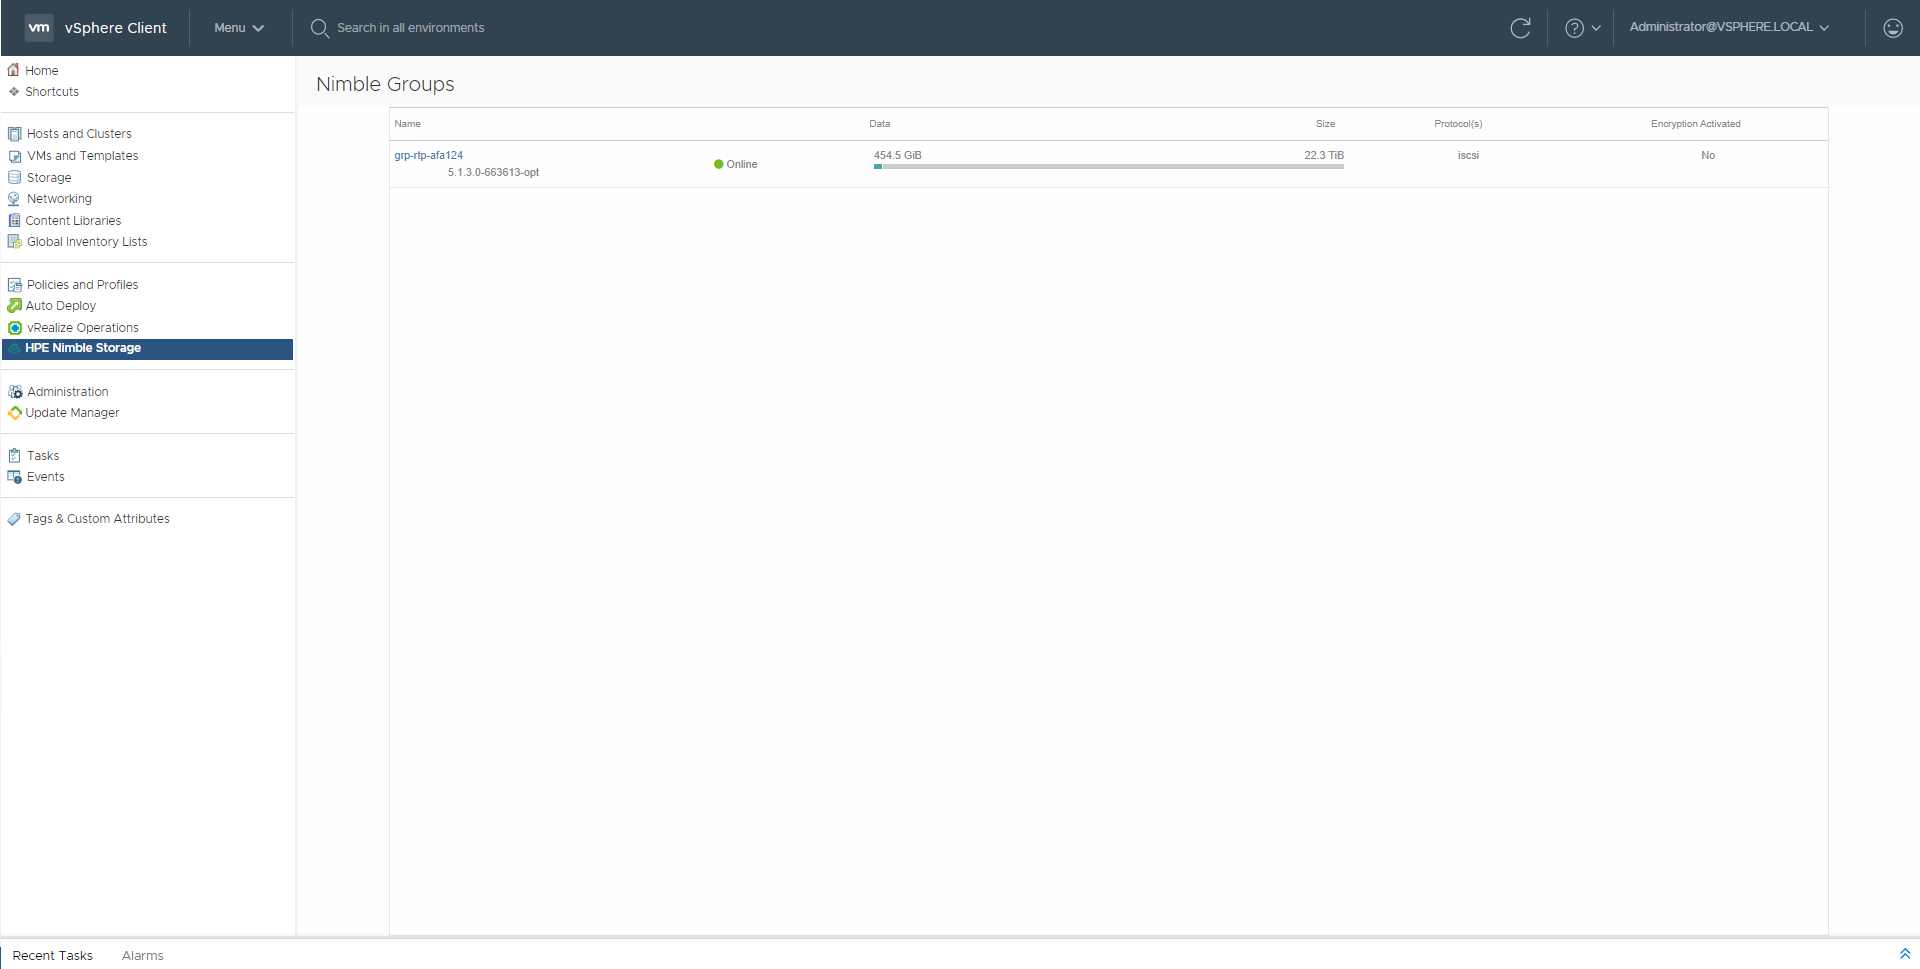
Afterwards, you can select the particular Nimble Groups that you would like to manage.
Note that in this example, I only have one dHCI solution. You could have multiple dHCI solutions connected to the same vCenter. In that case, you would see all of them from this view.
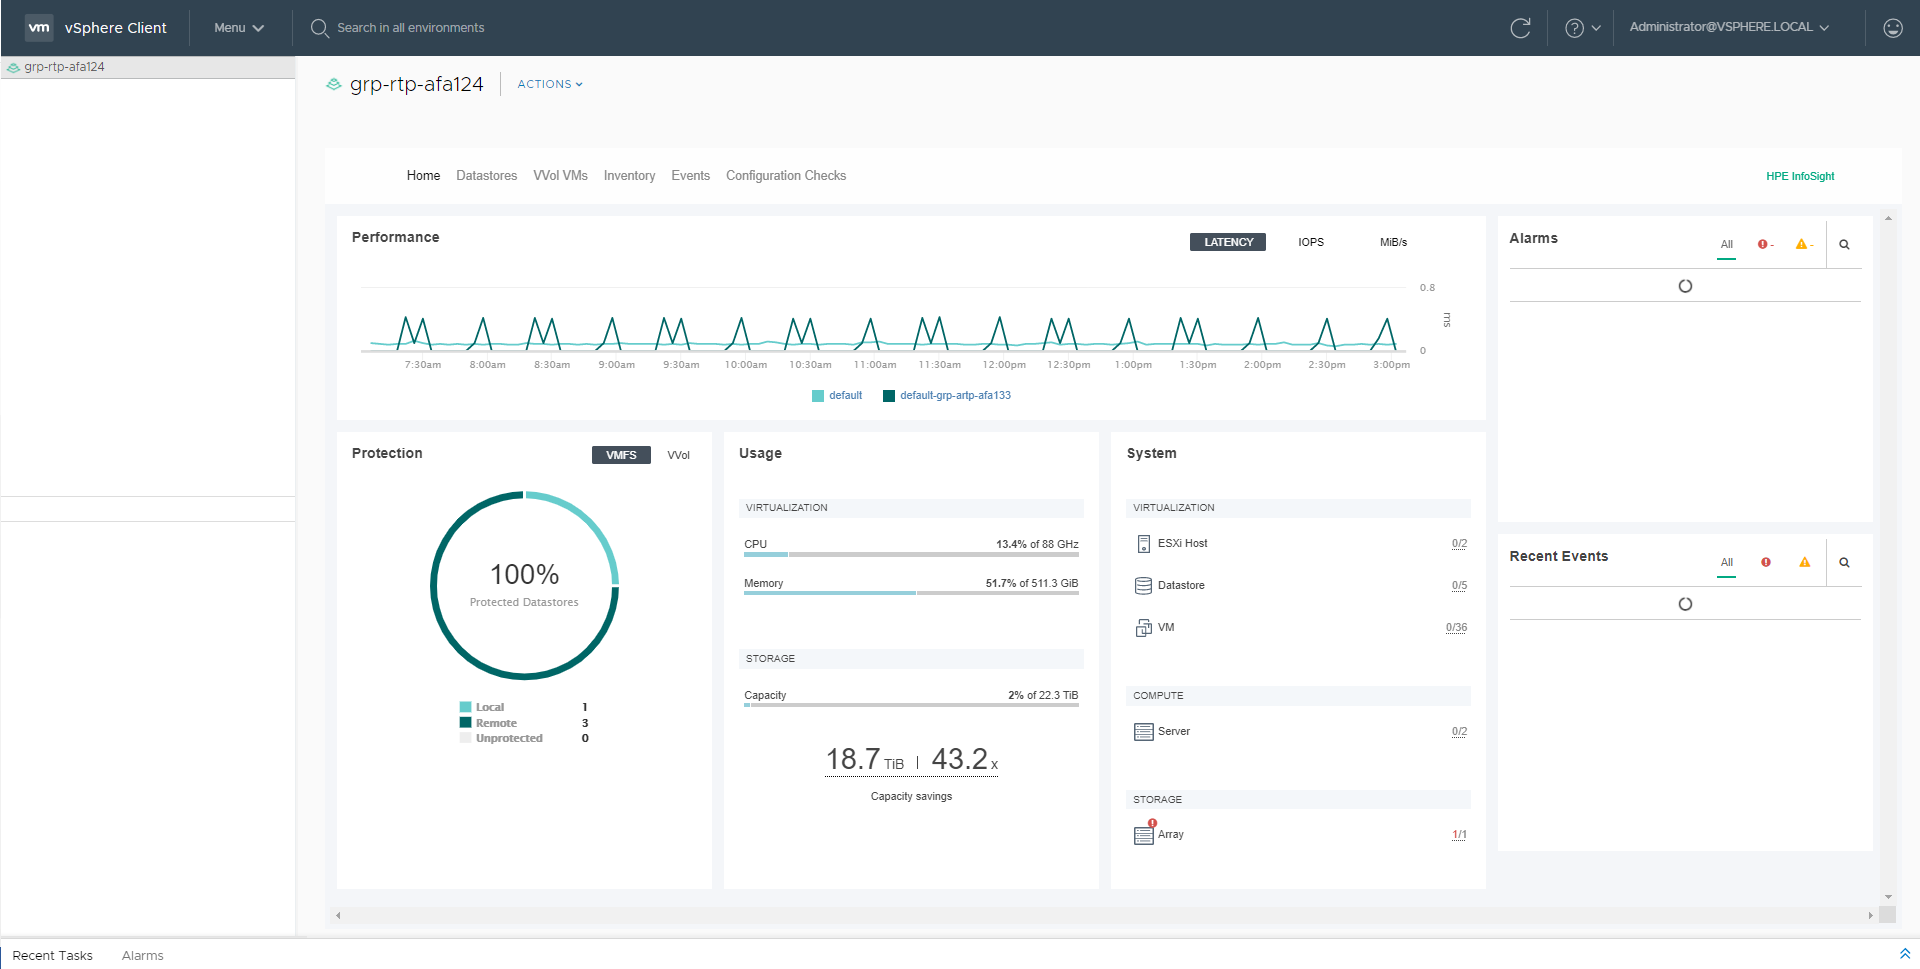
After clicking on Nimble Groups, you see the Home dashboard. At the top of the screen, there are several menu options such as Home, Datastores, VVoL VMs, Inventory, Events and Configuration Checks.
Here’s a nice video where you can get a full overview of the plugin and each of the tabs.
Let’s have a look into each section.
Home
Home dashboard is where you get an overview of your infrastructure. On top, you see the overall performance of your HPE Nimble Storage array in terms of latency, IOPS and MiB/s. Below you have Protection, where you can see if your VMFS datastores or individual VVol virtual machines are currently being protected. The dashboard reports on provided through replication and local array based snapshots. The Usage section provides an overview of CPU and RAM utilization of your ESXi hosts. It also provides Capacity Utilization as well as Capacity Savings.
The Systems section shows the hardware status of your ESXi hosts and your storage array. On the right side you have Alarms and Recent Events that show details of recent failures, along with configuration change that need your attention.
Datastore and VVol VMs
Current Nimble customers will recognize this screen, as this is same to the revamped HTML5 vSphere plugin we have delivered in NimbleOS 5.1.
To learn more about Datastore and VVol VMs, please have a look at this blog article https://community.hpe.com/t5/HPE-Storage-Tech-Insiders/3-Reasons-for-switching-to-HPE-Nimble-Storage-H5-vCenter-plugin/ba-p/7041557#.XZulokZKiUk
Inventory
Server
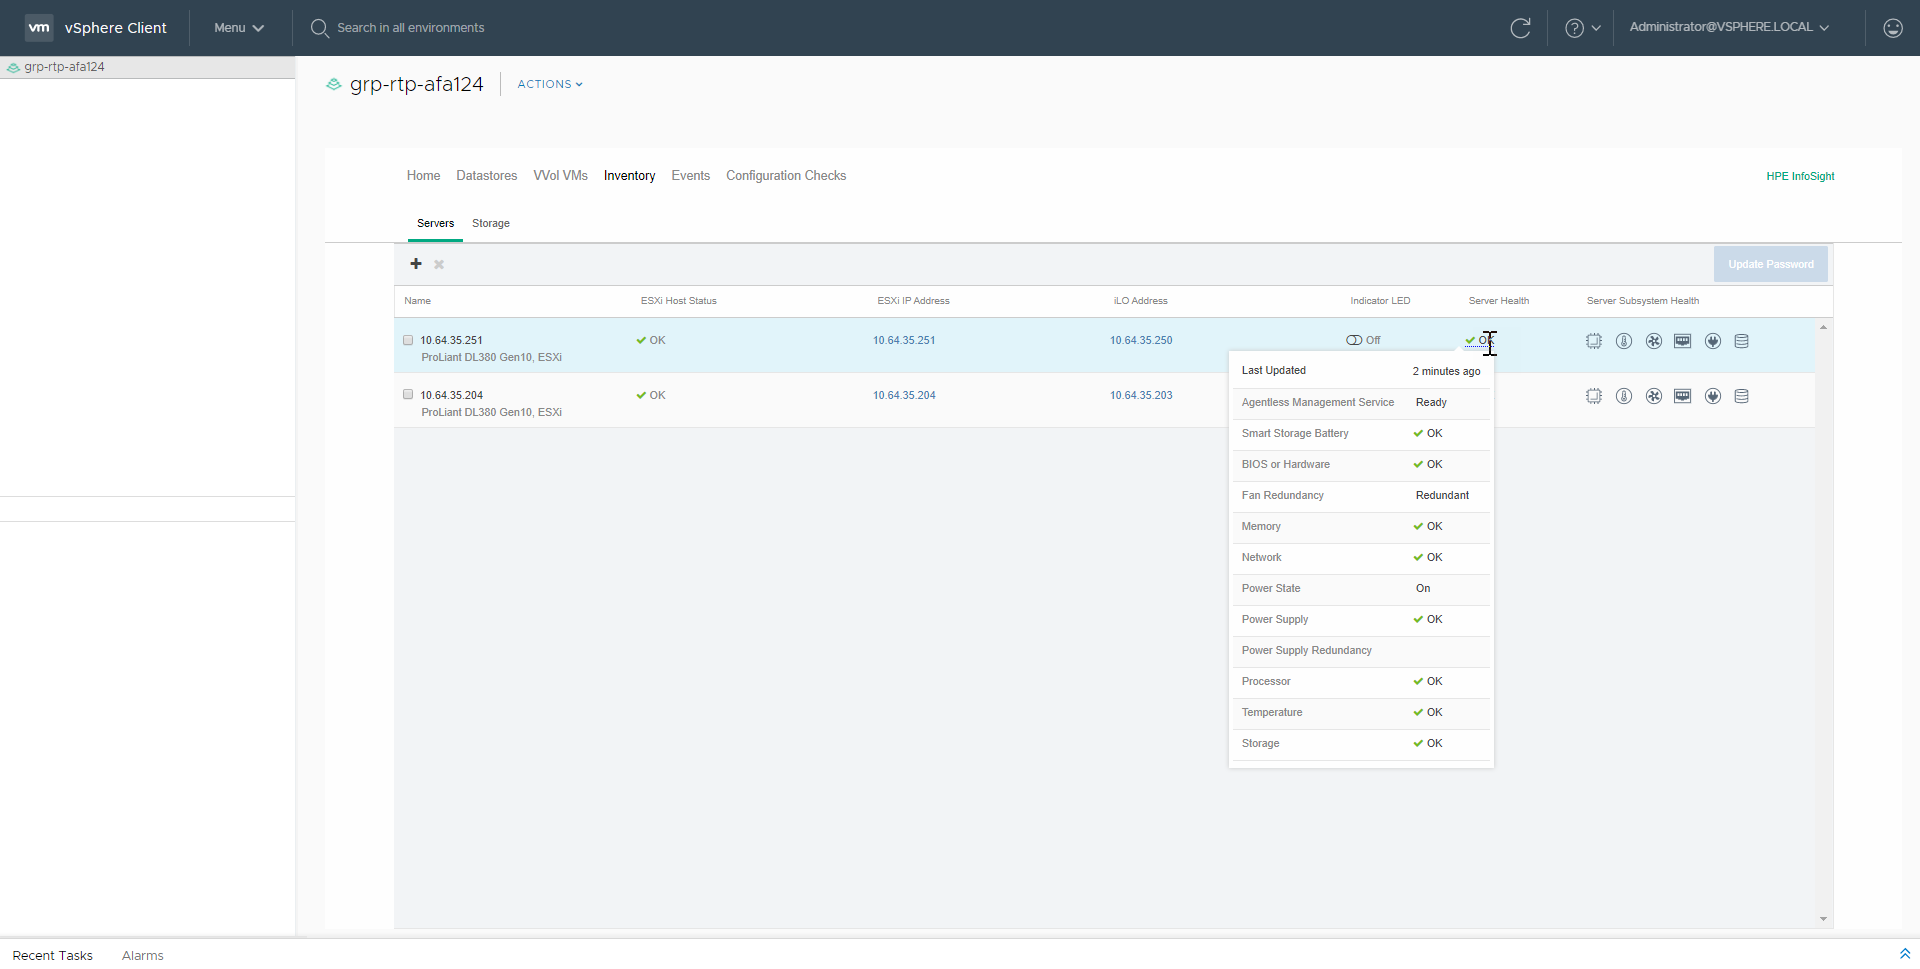
From this view, you can see all hosts that belong to your dHCI solution. You can see various information such as ESXi IP address, ILO address and Server Heath as well. Server Health is pulled from the ILO interfaces every 5 min.
You can easily add new servers using the + sign on the upper left side of the screen. To see this feature in action, have a look at this demonstration:
Storage
The Storage tab shows various information with regards to your HPE Nimble Storage array. You can see usage of your array, space savings, performance, health information and even replication partnerships!
Events
Under Events, you can see log and alarms coming from your HPE Nimble Storage array. From this view you can easily apply a filter to search across the logs.
Configuration Checks
This is the Last tab but certainly one of my favorite. Configuration Checks runs 54 checks against your environment and tests them against VMware, Nimble and ProLiant best practices to make sure your environment stays in good shape. It runs every 24 hours but it can be run as often as you like using “Rerun Checks”.
Keep in mind that this list will evolve in the future based on any potential issues we might find and any new features that we introduce. (Stay tuned!)
Summary:
We’ve made this platform simple for anyone to manage full-stack infrastructure, giving customers enterprise capabilities without any of the associated complexity and this experience is all through an innovative software layer we built that automates stack management connected in with vCenter.
Customers don’t have to spend any time in the various silo element managers as the resources are abstracted from the physical hardware and managed through vCenter which makes it really easy for a VM admin to manage.
- Back to Blog
- Newer Article
- Older Article
- haniff on: High-performance, low-latency networks for edge an...
- StorageExperts on: Configure vSphere Metro Storage Cluster with HPE N...
- haniff on: Need for speed and efficiency from high performanc...
- haniff on: Efficient networking for HPE’s Alletra cloud-nativ...
- CalvinZito on: What’s new in HPE SimpliVity 4.1.0
- MichaelMattsson on: HPE CSI Driver for Kubernetes v1.4.0 with expanded...
- StorageExperts on: HPE Nimble Storage dHCI Intelligent 1-Click Update...
- ORielly on: Power Loss at the Edge? Protect Your Data with New...
- viraj h on: HPE Primera Storage celebrates one year!
- Ron Dharma on: Introducing Language Bindings for HPE SimpliVity R...


