- Community Home
- >
- Storage
- >
- Around the Storage Block
- >
- Cross-Stack Analytics for Hyper-V with HPE InfoSig...
Categories
Company
Local Language
Forums
Discussions
Forums
- Data Protection and Retention
- Entry Storage Systems
- Legacy
- Midrange and Enterprise Storage
- Storage Networking
- HPE Nimble Storage
Discussions
Forums
Discussions
Discussions
Discussions
Forums
Discussions
Discussion Boards
Discussion Boards
Discussion Boards
Discussion Boards
- BladeSystem Infrastructure and Application Solutions
- Appliance Servers
- Alpha Servers
- BackOffice Products
- Internet Products
- HPE 9000 and HPE e3000 Servers
- Networking
- Netservers
- Secure OS Software for Linux
- Server Management (Insight Manager 7)
- Windows Server 2003
- Operating System - Tru64 Unix
- ProLiant Deployment and Provisioning
- Linux-Based Community / Regional
- Microsoft System Center Integration
Discussion Boards
Discussion Boards
Discussion Boards
Discussion Boards
Discussion Boards
Discussion Boards
Discussion Boards
Discussion Boards
Discussion Boards
Discussion Boards
Discussion Boards
Discussion Boards
Discussion Boards
Discussion Boards
Discussion Boards
Discussion Boards
Discussion Boards
Discussion Boards
Discussion Boards
Discussion Boards
Community
Resources
Forums
Blogs
- Subscribe to RSS Feed
- Mark as New
- Mark as Read
- Bookmark
- Receive email notifications
- Printer Friendly Page
- Report Inappropriate Content
Cross-Stack Analytics for Hyper-V with HPE InfoSight – get to know your newest power tool!
Hewlett Packard Enterprise customers running Microsoft® Hyper-V virtualization have something exciting to look forward to this summer.
Introducing Cross-Stack Analytics for Hyper-V on HPE InfoSight!
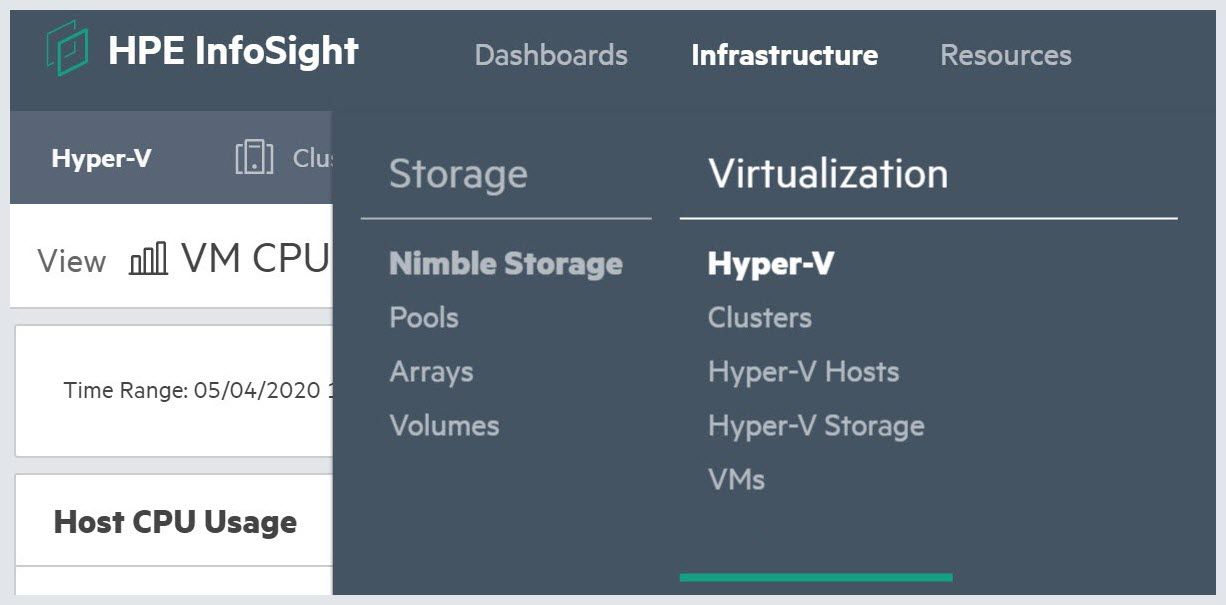
This new functionality offers Hyper-V customers end-to-end visibility and insights into their virtualized environments. Formerly known as VMVision back in the Nimble Storage days, Cross-stack Analytics for VMware has been an HPE customer-favorite for many years. Now Microsoft Hyper-V customers will get to experience its power, as well.
Seamless troubleshooting
Backed by one of the industry’s leading predictive analytics and support automation ecosystems for AIOps, Cross-Stack Analytics for Hyper-V enables seamless troubleshooting by visualizing relationships between clusters, hosts, VMs, and storage. With the help of HPE InfoSight, Hyper-V administrators can now quickly identify overloaded hosts or noisy neighbors, find inactive VMs, and even uncover underlying storage issues. Releasing first for HPE Nimble Storage, the goal of Cross-Stack Analytics for Hyper-V is to simplify VM capacity management and provide deep insights for performance troubleshooting. Let’s take a closer look, shall we?
HPE InfoSight Collector Toolkit
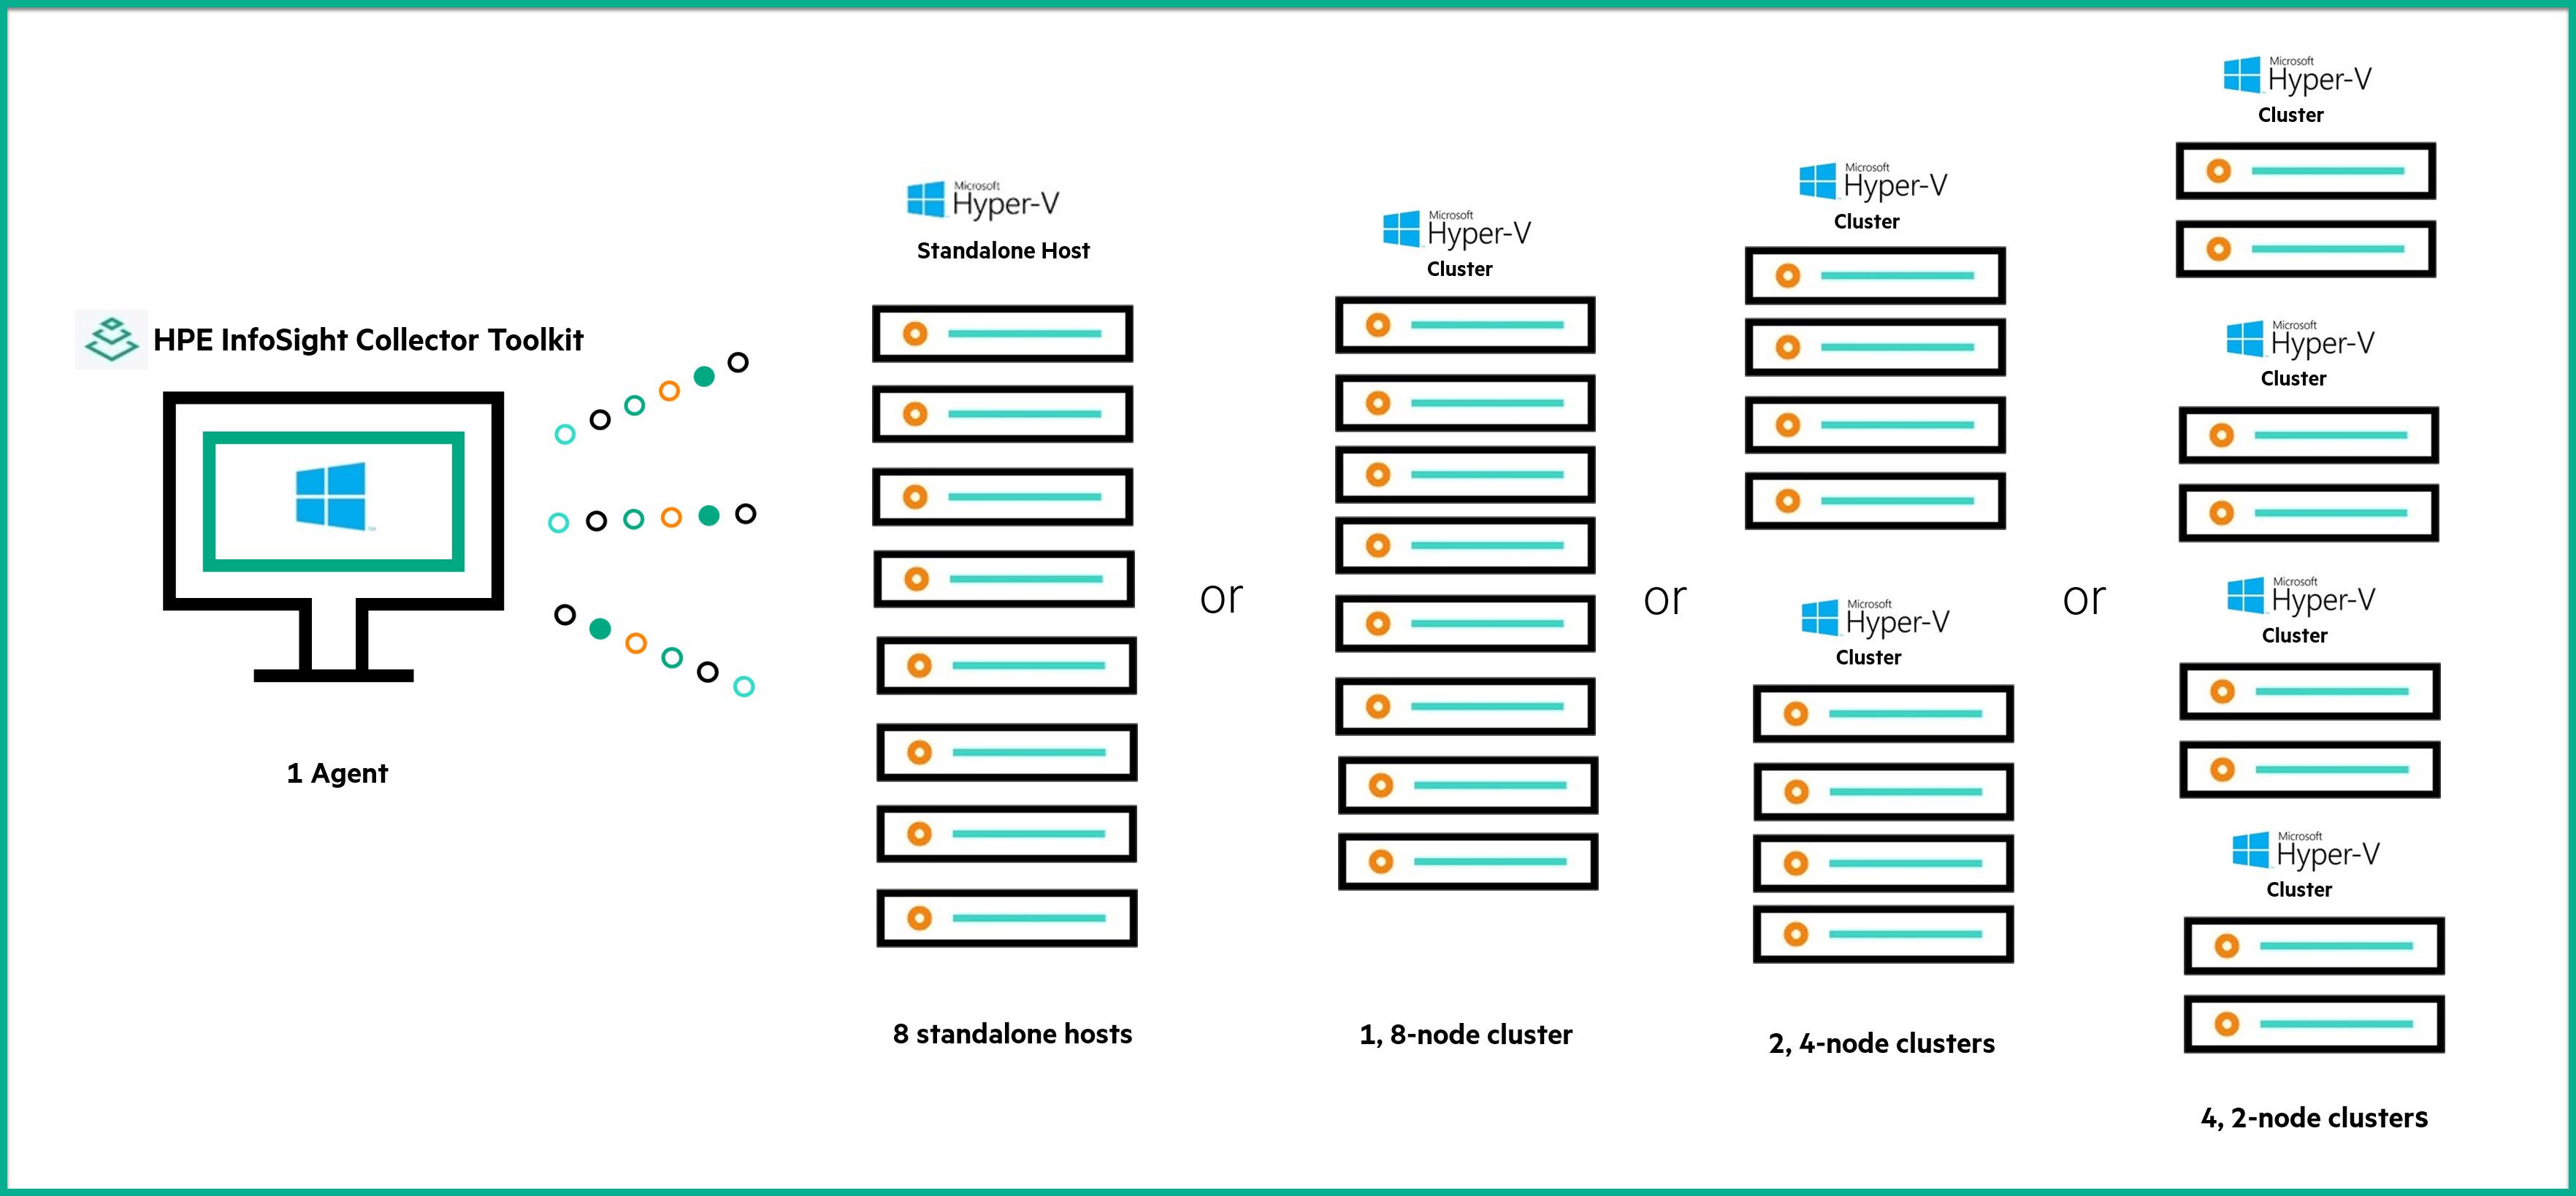
The telemetry data-gathering process is handled by the HPE InfoSight Collector Toolkit in combination with the HPE Nimble Storage array. This Toolkit, or agent, is installed on a Windows Server, which can be a VM or a physical host. Minimum requirements for this VM are covered in the release notes; however, it’s important to note that the Collector must be in the same Active Directory domain as the Hyper-V hosts or clusters to be included. Typically, one HPE InfoSight Collector Toolkit manages up to eight hosts and can do so in a number of combinations: eight stand-alone hosts, one 8-node cluster, two 4-node clusters, or four 2-node clusters. However, as the collector scales linearly with regards to CPU and Memory, it is capable of supporting larger environments.
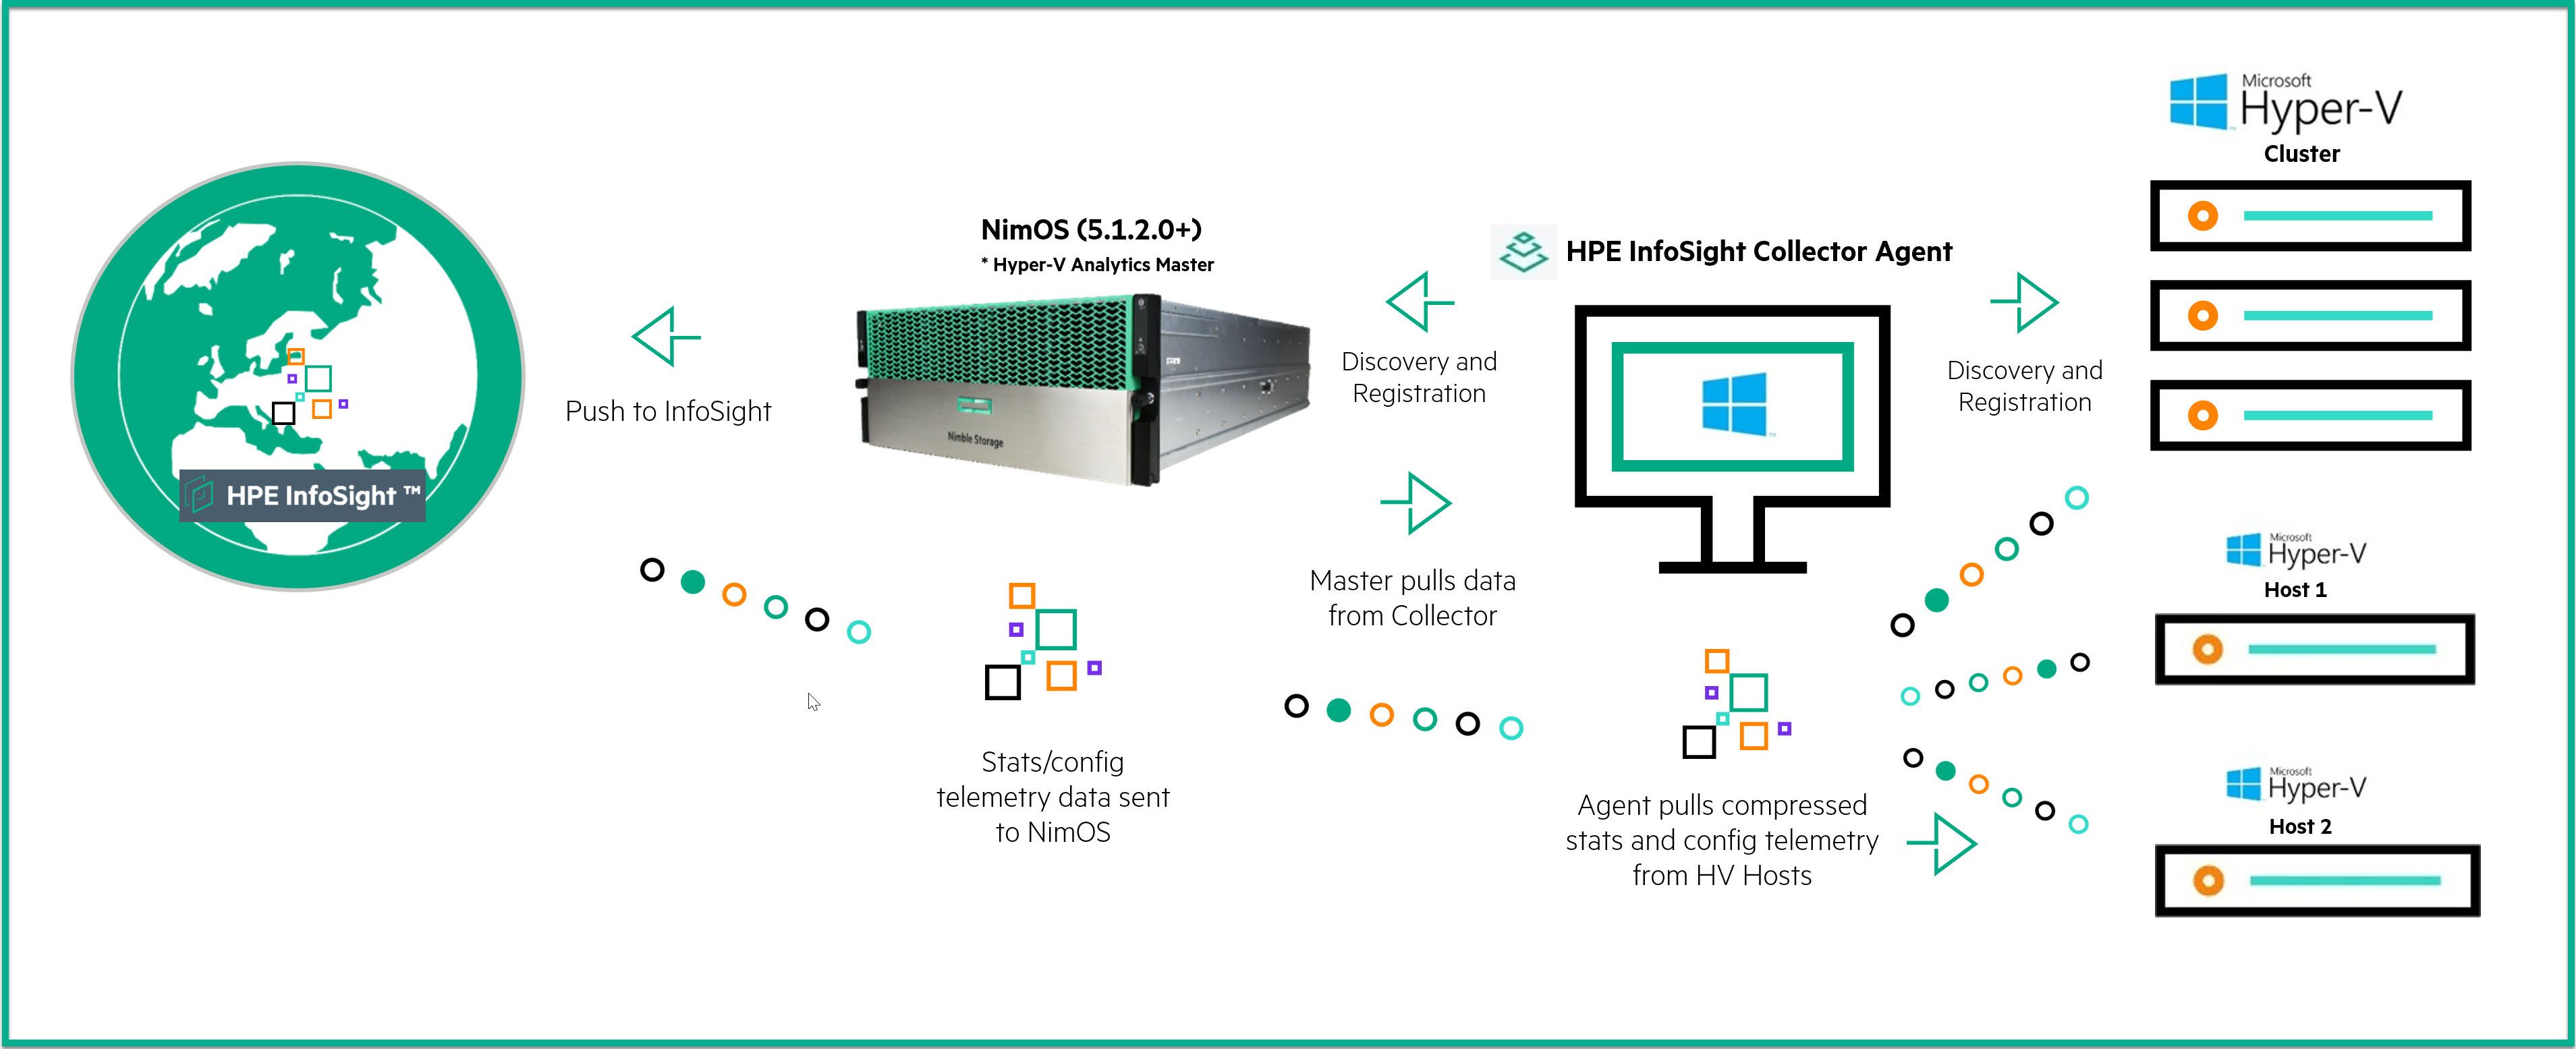
After the HPE InfoSight Collector Agent is installed and configured, it gathers performance statistics and configuration data remotely from Hyper-V hosts or clusters. Configuration and statistics metadata is compressed and stored locally on the Collector Agent until it is pulled by the HPE Nimble Storage array. These two payloads are then staged on local disks and sent to HPE InfoSight along with array heartbeats and diagnostics for HPE Nimble Storage analytics (DNA). The Cross-Stack Analytics for Hyper-V master software runs within NimbleOS (version 5.1.2.0 and later) and is responsible for the final push to HPE InfoSight, where the information becomes visible to customers.
For this section, I turned to Anagha Barve, one of our data scientists, to help me brush up on my Hyper-V chops. While there is certainly some parity between Hyper-V and a VMware configuration, Hyper-V is more complex because it has various modes of deployment which are common among customers. Depending on the mode of deployment, some objects in the hierarchy are not applicable.
To begin with, no object in the Hyper-V world is equivalent to a VMware datacenter. The highest-level object is the Hyper-V cluster. VMware vCenter® maps to Microsoft System Center Virtual Machine Manager (SCVMM). Unlike vCenter, which is heavily relied upon, not every customer deploys SCVMM in their environment. There are other management UIs as well, such as Windows Admin Center, but from what we’ve seen, customer adoption has been scattered. The HPE InfoSight Hyper-V Collector, as of today, does not gather and send System Center information. To summarize, SCVMM is optional in Hyper-V environments, and if present, it is equivalent to a VMware vCenter.
The Hyper-V host object maps to a VMware ESXi™ host, and a Hyper-V cluster maps to a VMware ESXi cluster. However, in the case of Hyper-V, the hosts are not always grouped into a cluster. So, there are standalone hosts and hosts that are part of a cluster. Thus, the cluster is another optional object in Hyper-V environments.
VMs run on a Hyper-V host or cluster. A single disk on a Hyper-V VM is a VHD, which maps to a VMware VMDK. A Windows PhysicalDisk maps to a volume on the array. VHDs reside on a logical volume. If the VM is running on a standalone host, its VHDs are created on standalone volumes (VHD®Windows Volume®PhysicalDisk).
If the VM is running on a cluster of hosts, its VHDs are created on clustered volumes. Note that clustered volumes are similar to standalone volumes, but they can be accessed by all nodes in the cluster, one at a time. This is done in an active-passive style in which only one node has ownership of the volume at a time, but all other cluster nodes can take ownership if needed.
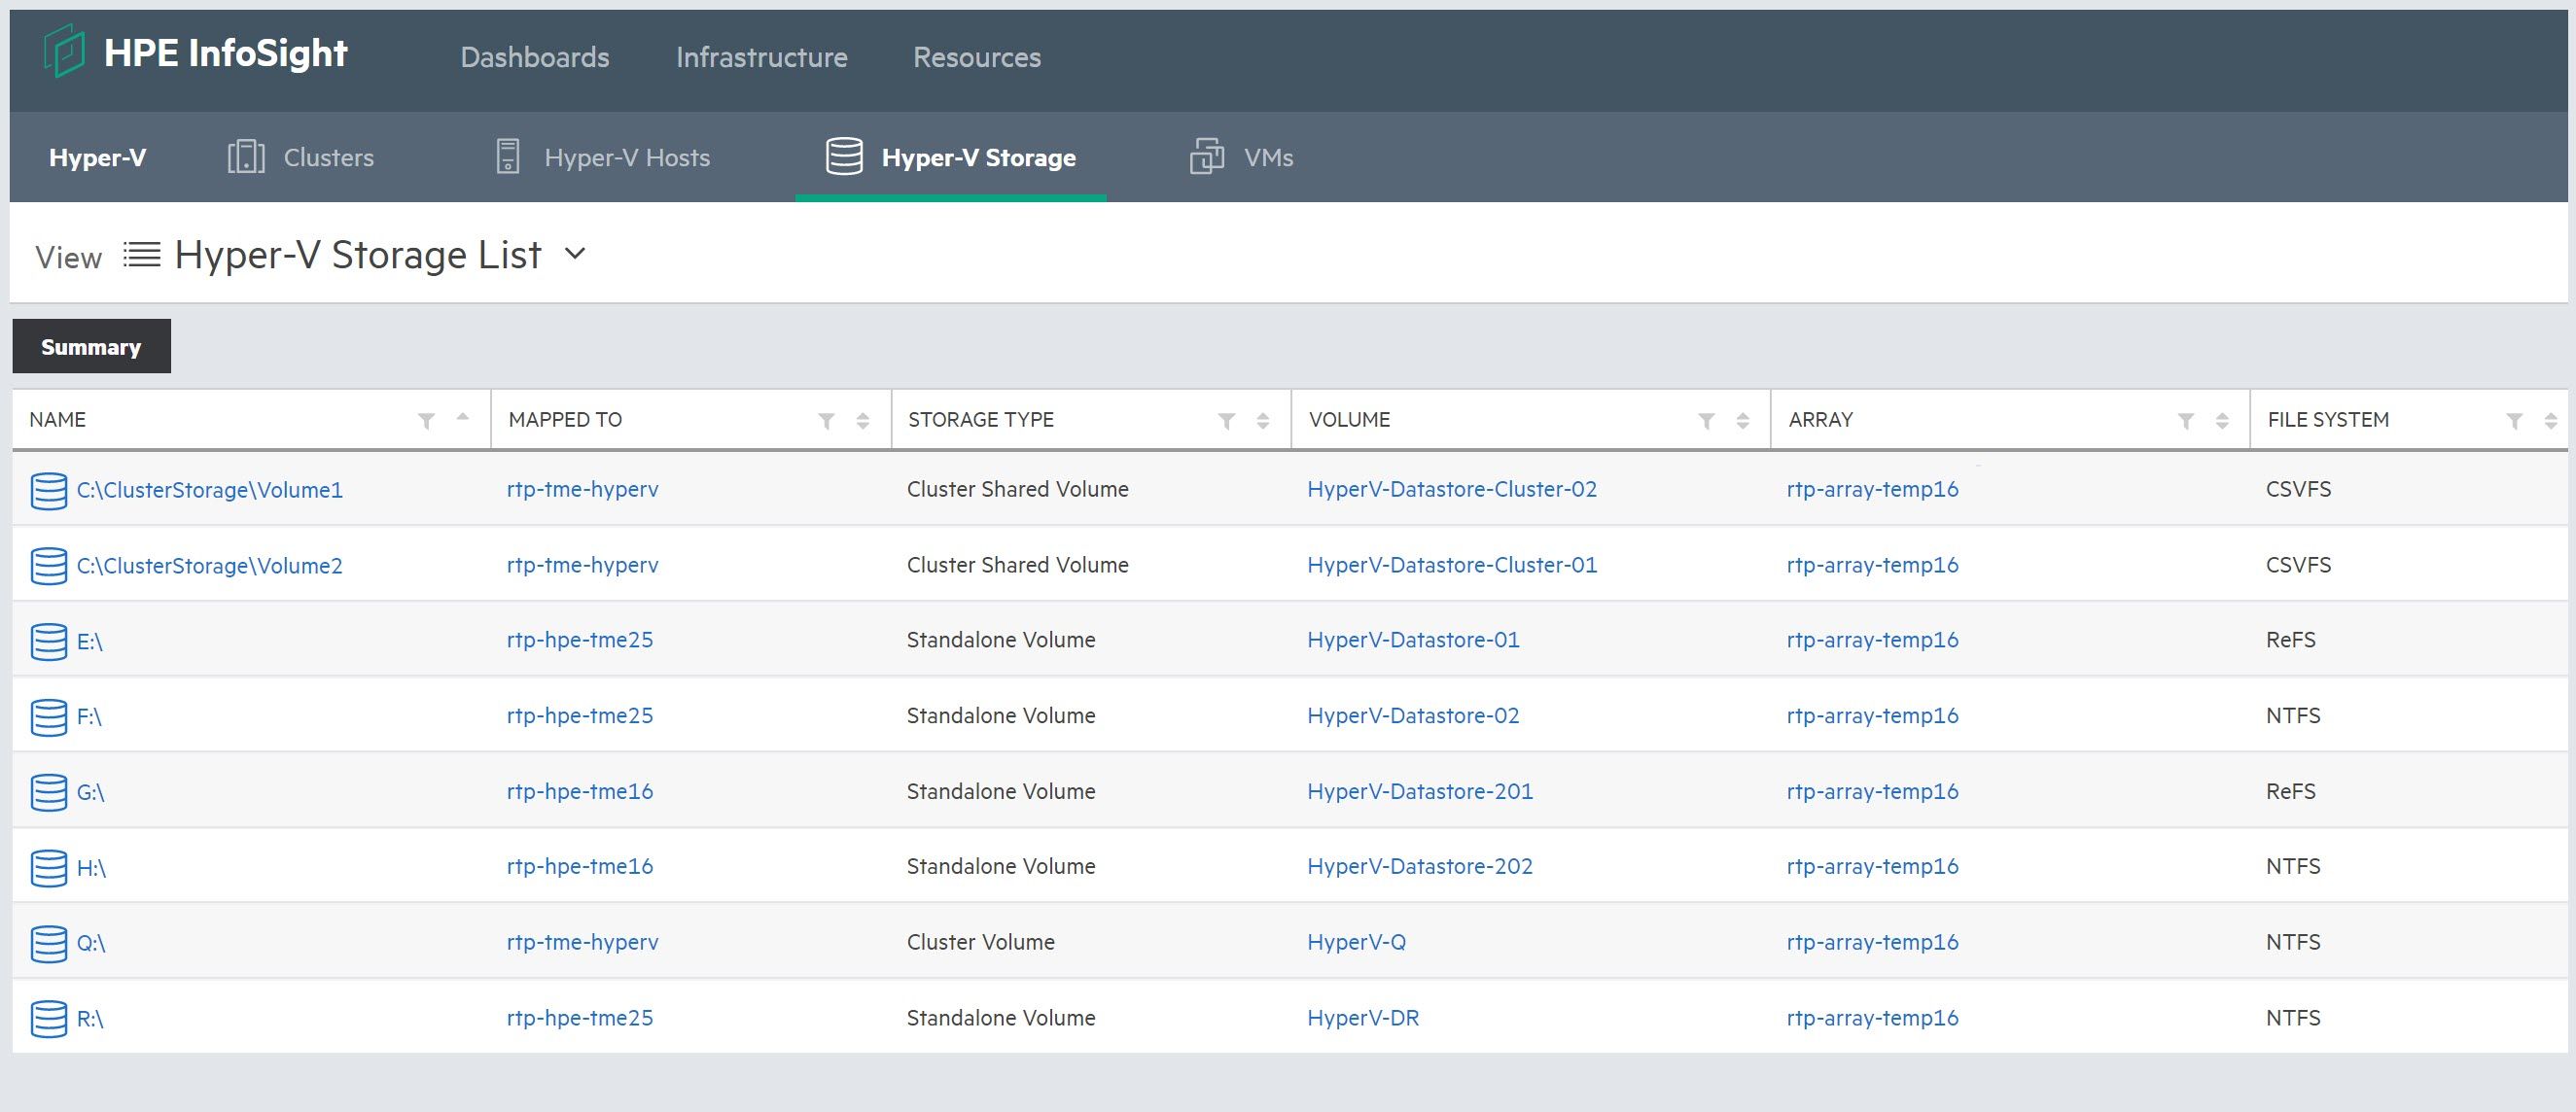
Clustered volumes can be configured as cluster shared volumes or CSVs. A CSV is a clustered volume with a clustered file system which allows the volume to be accessed by all nodes of the cluster simultaneously (active-active). This file system, called CSVFS, is the equivalent of the VMware shared file system, which is VMFS. To summarize, Hyper-V has volumes. Some are standalone, some are clustered, and some are CSVs. A Hyper-V CSV maps to a VMware datastore.
Cross-stack analytics for Hyper-V
And now, the fun part! Hyper-V analytics as seen in the HPE InfoSight web portal—Cross-Stack Analytics for Hyper-V.
One of the unique powers of HPE InfoSight is its ability to correlate previously siloed technology stacks. That’s what cross-stack means: You can connect the dots between storage, virtualization, and compute. For example, HPE Nimble Storage dHCI customers can view the relationship between a VMware ESXi host and the HPE compute resource. They can see, for instance, that a driver issue on the physical host is affecting ESXi performance.
With Cross-Stack Analytics for Hyper-V, you can troubleshoot the Hyper-V storage volume from a virtualization standpoint, or change context and move to a storage-centric view of the associated HPE Nimble Storage volume. If the VM storage runs out of space unexpectedly, you can quickly check to see if deduplication is enabled on the array volume. You can verify everything from one place through a single-pane-of-glass view that is powered by mature machine-learning models and cutting-edge product integration.
For administrators and engineers who use Microsoft virtualization, finding the right tool to monitor and troubleshoot Hyper-V environments has been a long-standing pain point. Things get even more complicated in a clustered environment. HPE InfoSight provides excellent data visualization and analysis, ranging from a bird’s-eye cluster view down to a view of latency per single VHD disk on one particular VM.
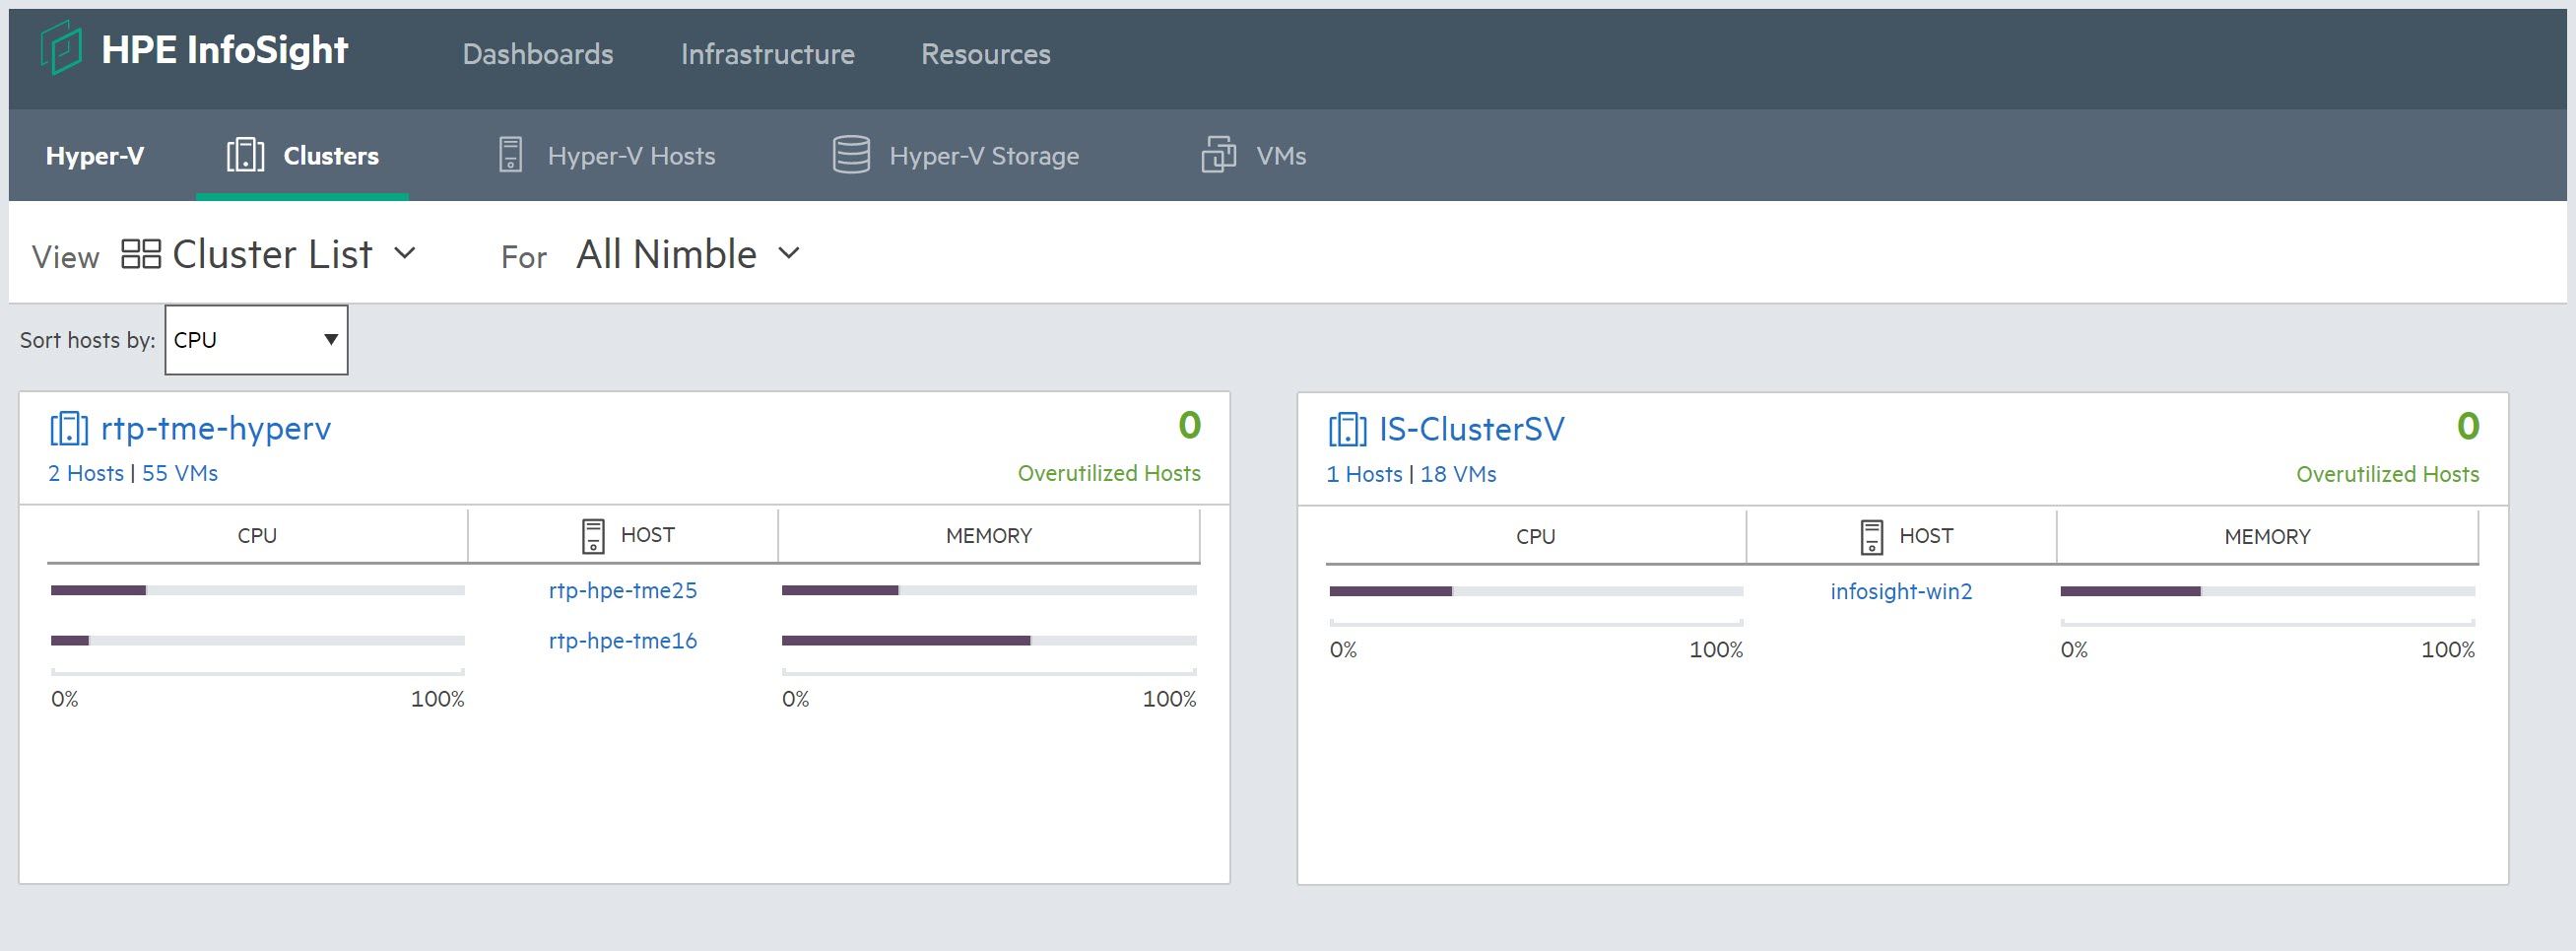
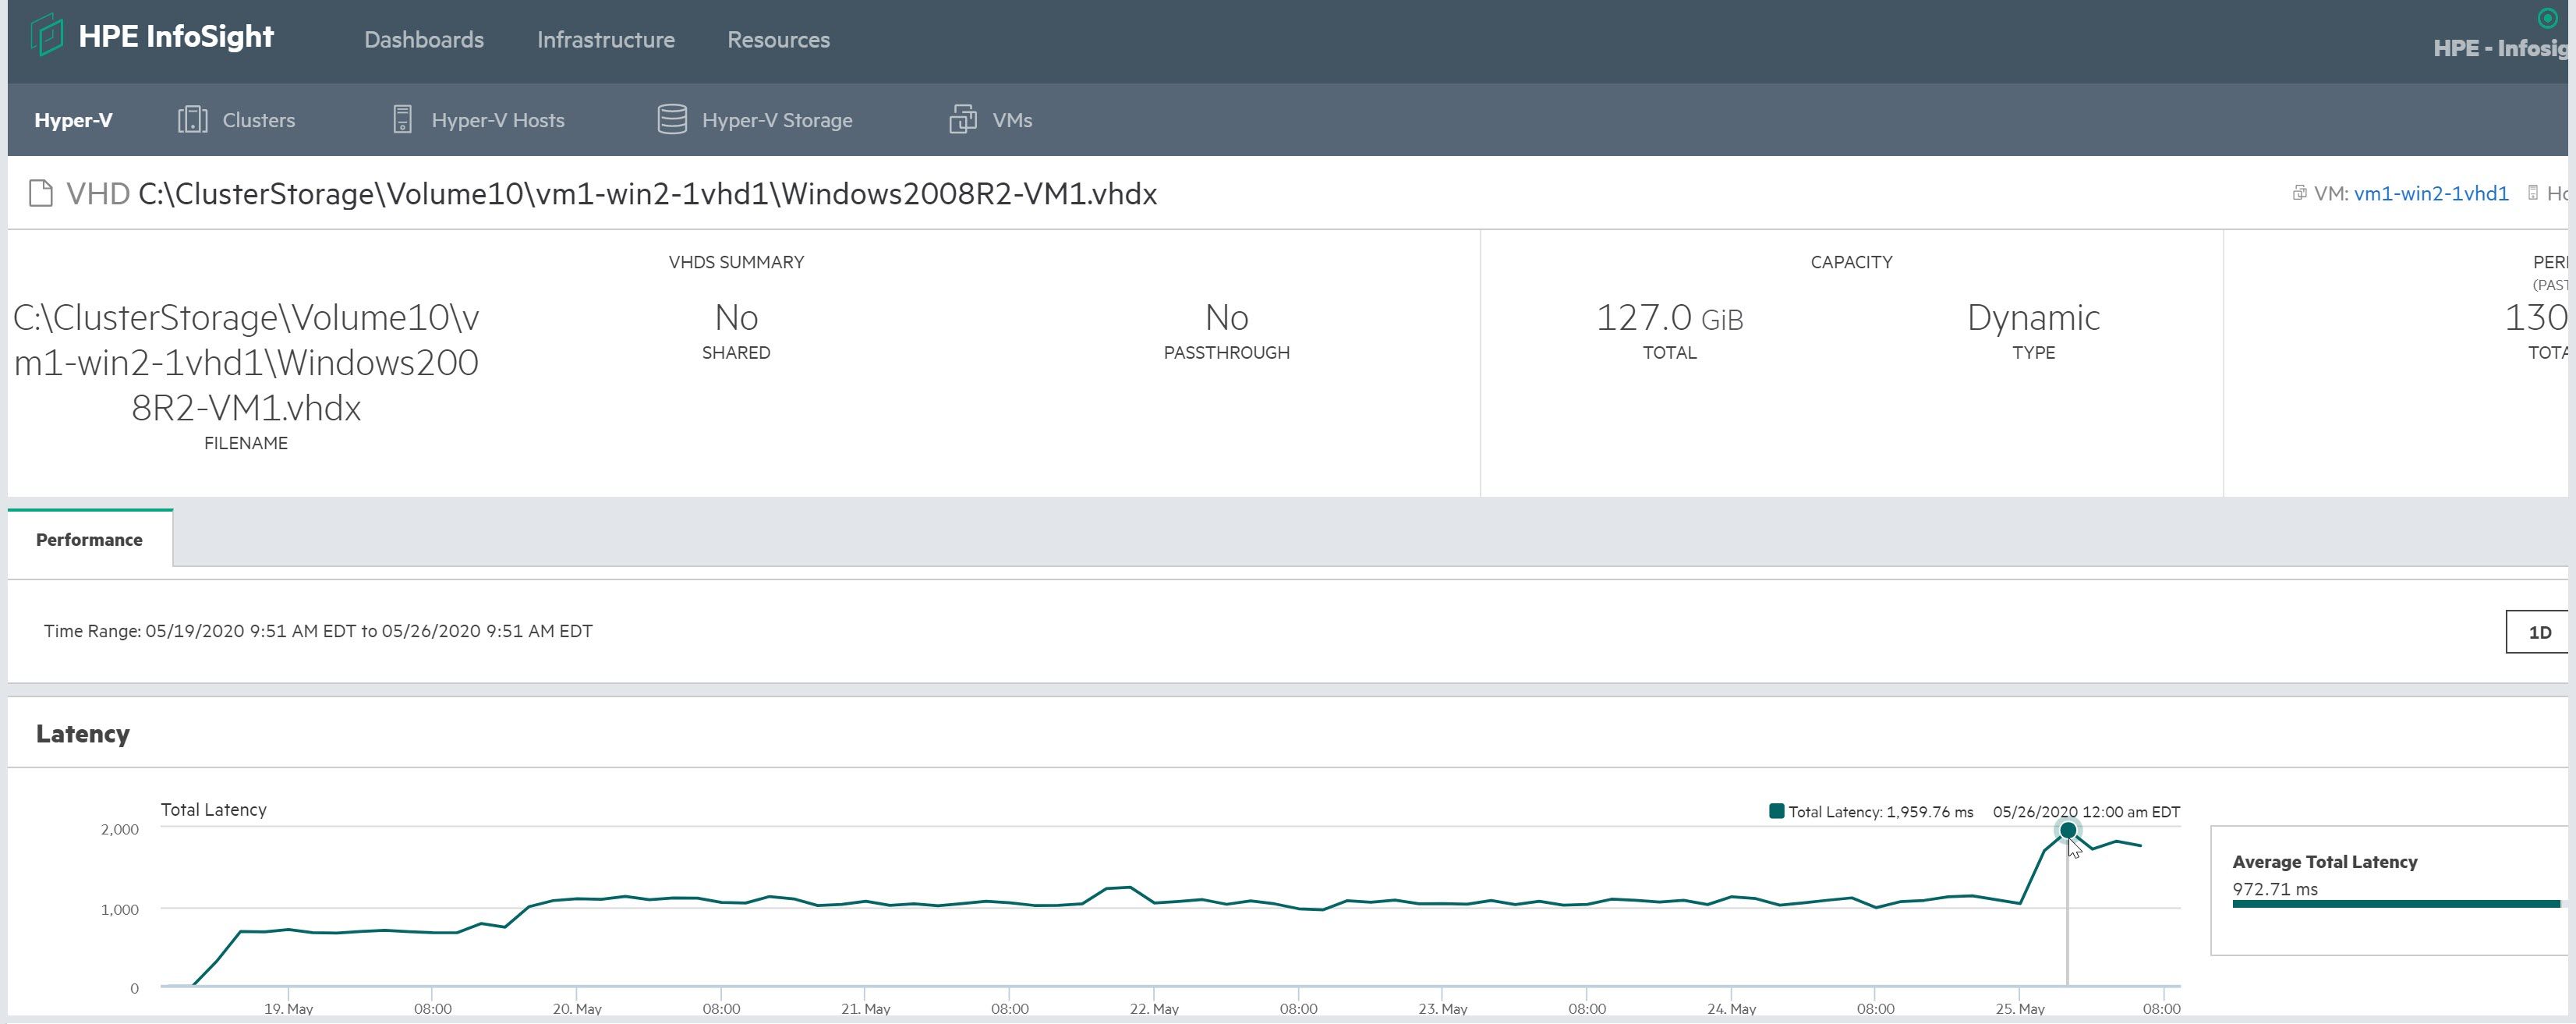
One scenario in which HPE InfoSight has proven extremely useful for VMware customers is diagnosing a noisy neighbor situation. No, we’re not talking about the kind of neighbor who always plays the stereo too loud; we’re talking about a VM that uses more than its fair share of resources. Sometimes a VM running on a certain datastore or host consumes so many resources that other VMs suffer and experience performance degradation. Now, like VMware customers, Microsoft customers will also get the benefit of noisy neighbor diagnosis.
From the VM’s main menu, you can use the drop-down menu to access Hyper-V trend analytics. These tools allow you to visualize per-VM capacity usage, as well as I/O, memory, and CPU contention over time.
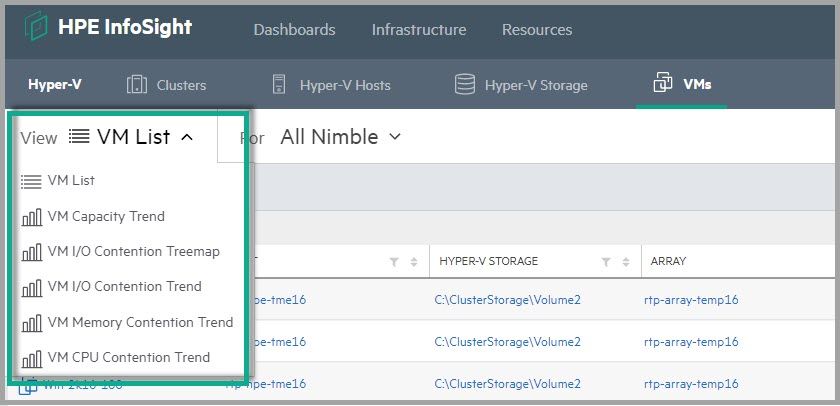
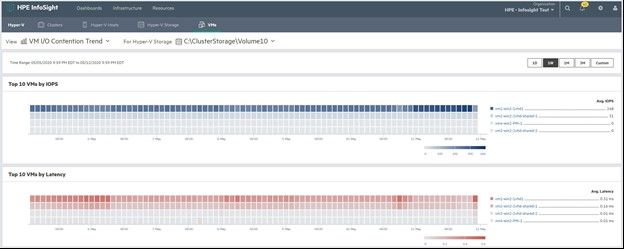
Let’s go over a few of the tools found in this VM drop-down menu. The VM I/O Contention Trend report offers multiple insights. The blue chart on top shows the top 10 VMs and their average IOPs for a given storage object. The red chart below it shows the top 10 VMs by average latency for the selected time interval. You can select reports on similar stats for memory and CPU from the Contention Trend views listed in the drop-down menu (shown in the preceding figure).
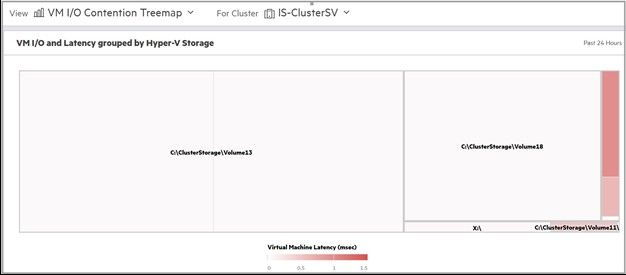
In the VM I/O Contention Treemap, for a given cluster or standalone host, all associated storage objects are ranked by their total IOPs for the last 24 hours. For each object, all associated VMs are ranked by their total IOPs, in addition to their average latency for the last 24 hours. The larger the box, the more IOPs, and the darker the color, the more latency. This is a nice way to visualize data, and it enables you to quickly find hotspots.
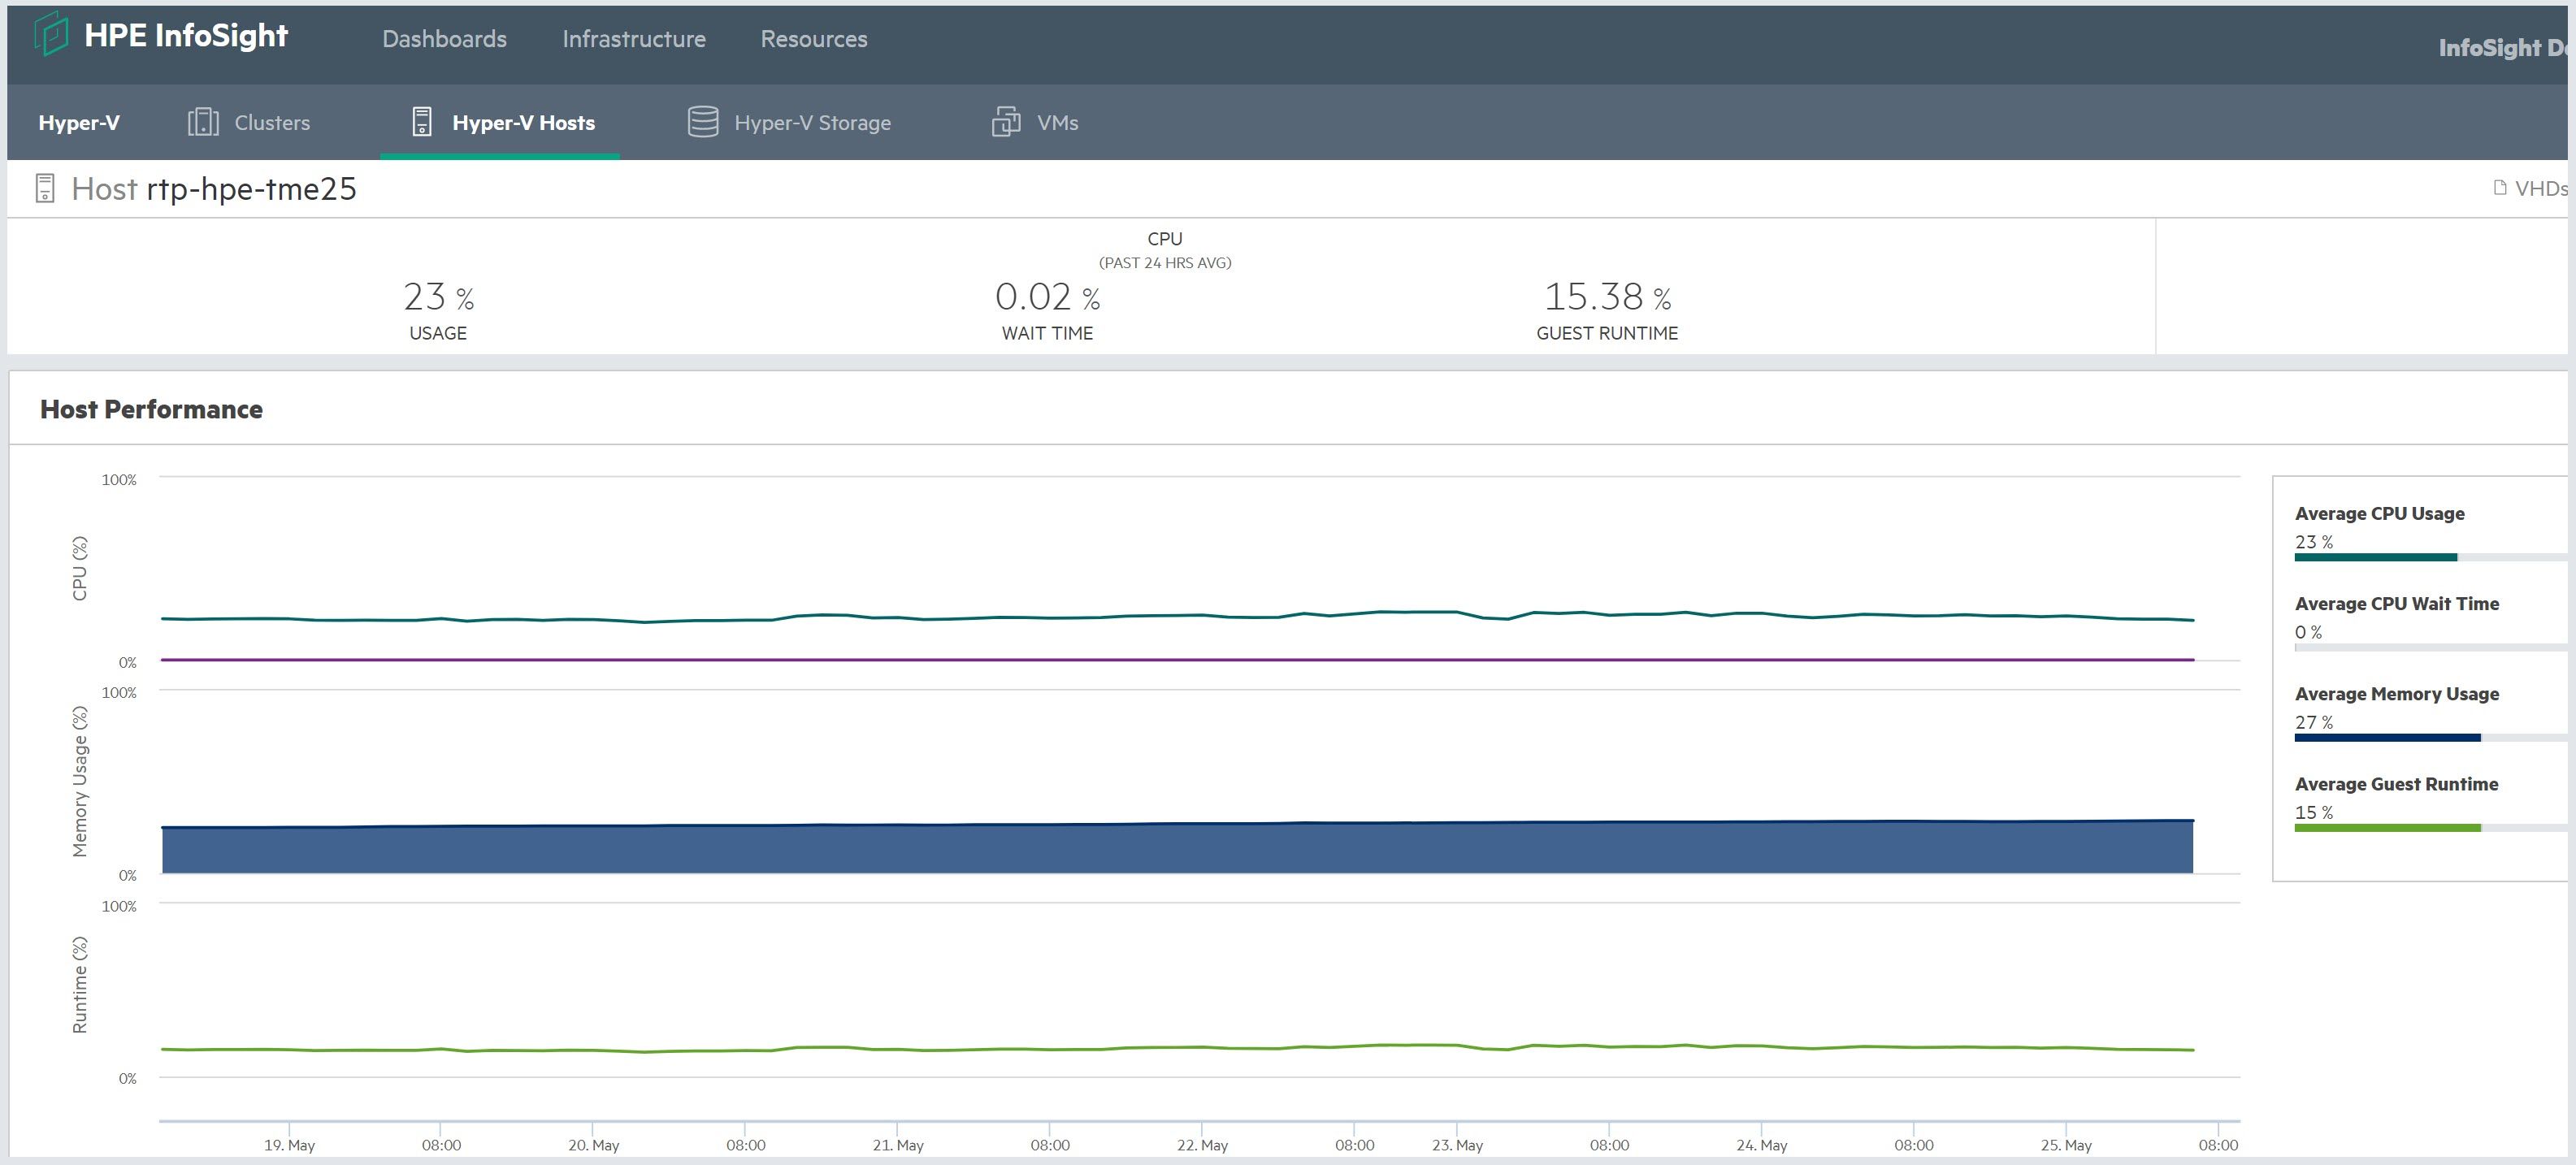
In addition to noisy neighbor analysis, Cross-Stack Analytics for Hyper-V and Cross-Stack Analytics for VMware on HPE InfoSight have almost identical feature sets; however, there are a few subtle differences. One difference is the ability to see the breakout of virtualization processing and resourcing versus the other processes that are running on a given Hyper-V host. Unlike the VMware ESXi operating system, for which running hypervisor-related processes is its main purpose, Windows Server can handle multiple roles. This flexibility is one reason datacenter engineers are drawn to Hyper-V—especially the small and medium-sized business (SMB) customers who must use their hardware for several purposes. By using Cross-Stack Analytics for Hyper-V, you can easily visualize and quantify the virtualization overhead (guest runtime) for a given host.
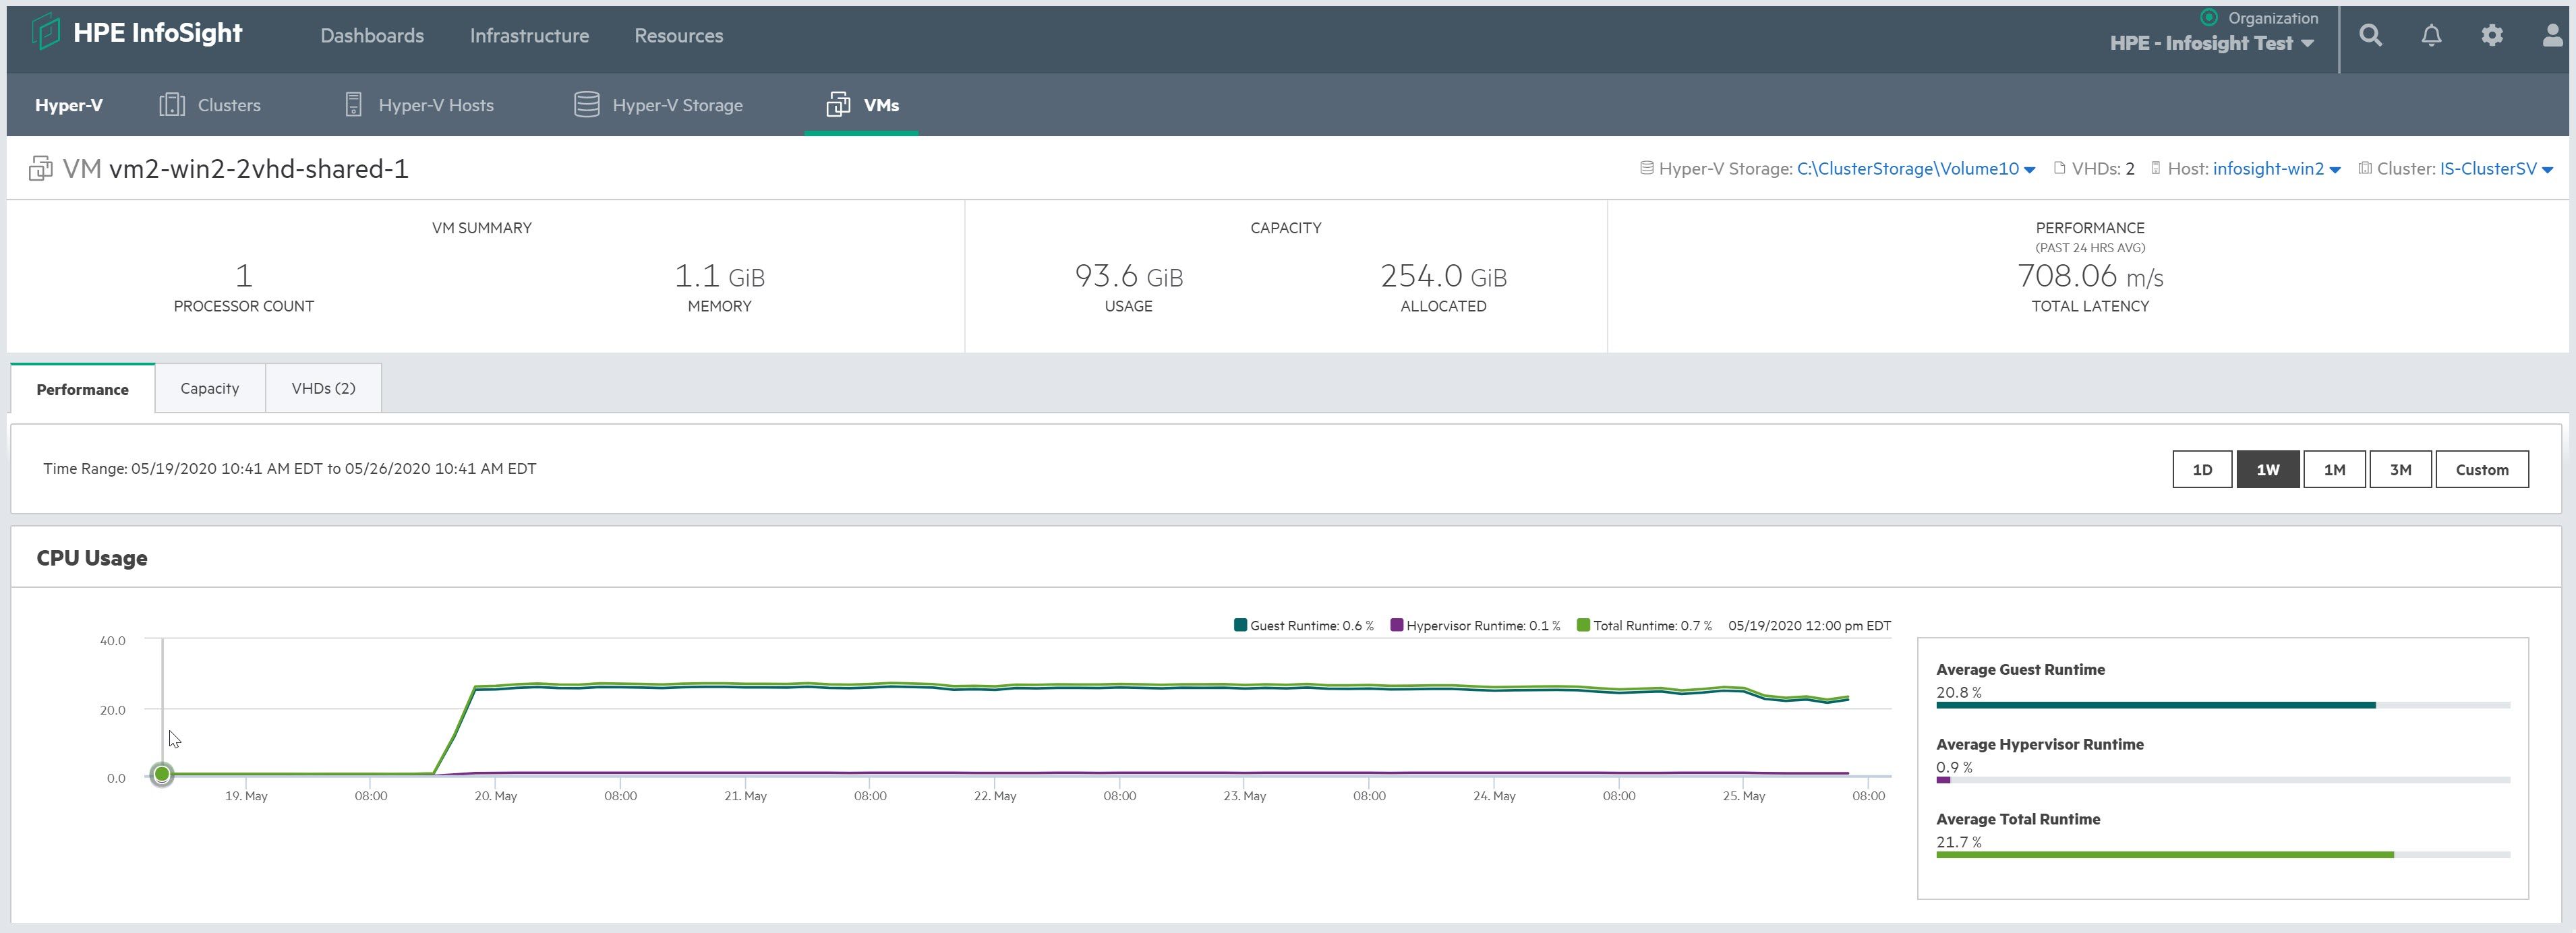
Hyper-V VMs have the same breakdown of the virtualization overhead or tax for running this Windows Server instance as a VM (called Hypervisor runtime).
The takeaway
“This is all great, Evans, but what’s the bottom line? What’s my takeaway?”
Well, there are several key benefits to remember:
- Single pane of glass for Hyper-V users
- Broad visibility for many HPE products with HPE InfoSight
- Great visualization of data on the web portal, which will be exciting for new users who haven’t seen it yet
- Great track record of success with its precursor, Cross-Stack Analytics for VMware (formerly known as VMVision)
- Benefits of both HPE Nimble Storage recommendations and Hyper-V Analytics in one place.
So with all of these benefits, the main takeaway is that every item on the list above is a big deal for HPE customers who use Hyper-V virtualization!
Please take a few minutes to share your experiences with other readers and me. I look forward to your feedback!
Additional resources
I urge to read Ankit’s blog here to see what else is new with HPE InfoSight. And, if you’re interested in seeing Cross-Stack Analytics for Hyper-V in action, check out these videos:
For more information on HPE Nimble Storage and Primera news, please check out these articles:
- HPE Nimble Storage celebrates a decade of innovation and steps into the future
- AI that acts on your behalf? It’s here NOW!
- Primary storage news for HPE Primera and HPE Nimble Storage
As a reminder, registration for HPE Discover 2020 is FREE!! With your registration, HPE will donate $10 to your choice of one of 10 featured causes. Join us and give back to organizations helping people, businesses, and communities around the world recover from the COVID-19 crisis. Read more about these organizations and the great work they are doing to support COVID-19 recovery around the world. (Terms and conditions apply.)
Note: Once registered, you will be able to sign in to HPE Discover and search by Session ID or by area of interest to build your schedule.
We look forward to seeing you virtually at HPE Discover 2020!
- Back to Blog
- Newer Article
- Older Article
- haniff on: High-performance, low-latency networks for edge an...
- StorageExperts on: Configure vSphere Metro Storage Cluster with HPE N...
- haniff on: Need for speed and efficiency from high performanc...
- haniff on: Efficient networking for HPE’s Alletra cloud-nativ...
- CalvinZito on: What’s new in HPE SimpliVity 4.1.0
- MichaelMattsson on: HPE CSI Driver for Kubernetes v1.4.0 with expanded...
- StorageExperts on: HPE Nimble Storage dHCI Intelligent 1-Click Update...
- ORielly on: Power Loss at the Edge? Protect Your Data with New...
- viraj h on: HPE Primera Storage celebrates one year!
- Ron Dharma on: Introducing Language Bindings for HPE SimpliVity R...

