- Community Home
- >
- Networking
- >
- IMC
- >
- Re: Viewing Network Bandwidth Utilization?
Categories
Company
Local Language
Forums
Discussions
- Integrity Servers
- Server Clustering
- HPE NonStop Compute
- HPE Apollo Systems
- High Performance Computing
Knowledge Base
Forums
- Data Protection and Retention
- Entry Storage Systems
- Legacy
- Midrange and Enterprise Storage
- Storage Networking
- HPE Nimble Storage
Discussions
Knowledge Base
Forums
Discussions
- Cloud Mentoring and Education
- Software - General
- HPE OneView
- HPE Ezmeral Software platform
- HPE OpsRamp Software
Knowledge Base
Discussions
Forums
Discussions
Discussion Boards
Discussion Boards
Discussion Boards
Discussion Boards
Discussion Boards
Discussion Boards
Discussion Boards
Discussion Boards
Discussion Boards
Discussion Boards
Discussion Boards
Discussion Boards
Discussion Boards
Discussion Boards
Discussion Boards
Discussion Boards
Discussion Boards
Discussion Boards
Discussion Boards
Discussion Boards
Discussion Boards
Discussion Boards
Discussion Boards
Community
Resources
Forums
Blogs
- Subscribe to RSS Feed
- Mark Topic as New
- Mark Topic as Read
- Float this Topic for Current User
- Bookmark
- Subscribe
- Printer Friendly Page
- Mark as New
- Bookmark
- Subscribe
- Mute
- Subscribe to RSS Feed
- Permalink
- Report Inappropriate Content
04-08-2014 10:25 AM
04-08-2014 10:25 AM
Viewing Network Bandwidth Utilization?
Currently using IMC 7.0 standard trial verison. After successully installing IMC, I cannot figure out how to view network bandwidth utilization on switches. I used to use PCM + and seeing this data was quite simple. I do not have the NTA module installed (is that needed for such a basic function?).
Things I have tried:
- Watched IMC YouTube videos
- Tried to adding additional monitors for % inbound/outbound/bps of interface traffic. keeps erroring out that too many monitors (more than 10) are added.
Is it possible to get a similar aggrated switch bandwidth view which PCM+ displayed while still being able to drill down to the interface level.
Please advise
Bob
- Mark as New
- Bookmark
- Subscribe
- Mute
- Subscribe to RSS Feed
- Permalink
- Report Inappropriate Content
04-14-2014 10:12 AM
04-14-2014 10:12 AM
Re: Viewing Network Bandwidth Utilization?
I had the same problem when I moved from PCM to IMC. I can get you working on the bandwidth monitoring, but you won't have the ability to see who is using the bandwidth without getting NTA. PCM had the ability to show you who the top talkers were on a per-minute basis, which was great when trying to figure out who was using the bandwidth on a small pipe, such as a single T1. NTA kicks the snot out of PCM when it comes to traffic analysis and reporting, you may want to buy it if you need that kind of info.
OK, how to get it so you can see your bandwidth utilization:
1. setup performance monitoring
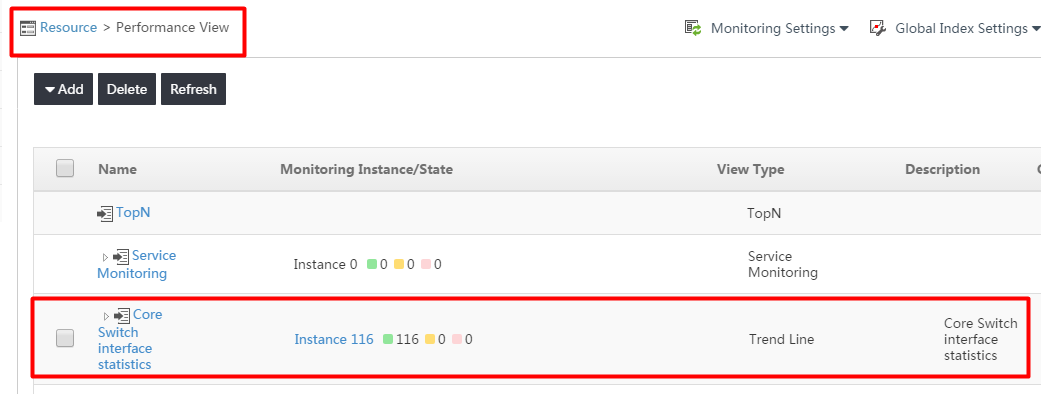
- click Resource - Performance Mangement - Performance View
- Click Add - Trend Line
- Select "System - Interface Statistics"
- Click Add next to Interface Receiving rate (bps) and Transmitting rate (bps)
- Click the "Interface" button
- Click Device View - Switches
- click a switch that has a port you want to monitor
- Click the port and click the down arrow to add it to the selected interfaces box
- you can click on the Device List tab to select another switch and add more ports/interfaces
- when done, click OK, Next, Save
- Give it a name and description (ie: Name: T1 locations. Description: All sites with a single T1)
- Click OK, Close
2. Set Alert threshold
- If you group interfaces that have the same utilization thresholds, such as all sites with singe T1s, you can then click the "gear" setting to the right of the monitoring instance in the performance view screen.
- Click Modify Threshold
- Uncheck the Global Index Settings option
- select the Receive Rate and set it to what you want your threshold to be. Here is what I do for my T1 sites:
- Threshold 1 value = 1.2 Repeat Times = 15 Alarm level = Minor
- Threshold 2 value = 1.3 Repeat Times = 20 Alarm level = Major
- Interval = 60
Note: I set IMC to only alert on Major alarms and above
What this does is tells IMC to alert me when my T1 hits 1.3mbps 20 minutes in a row
Now that you have the monitoring setup, let it run for 30 minutes to collect some data
3. Monitor your traffic
Note: you can view traffic a couple different ways. I suggest setting up the Tiling method, but will explain both
3A - Monitoring on demand
- Click Resource - Performance Mangement - Performance View
- you should see the monitor you setup earlier. click on it and it will bring up the trend graphs you defined and show the thresholds you defined too
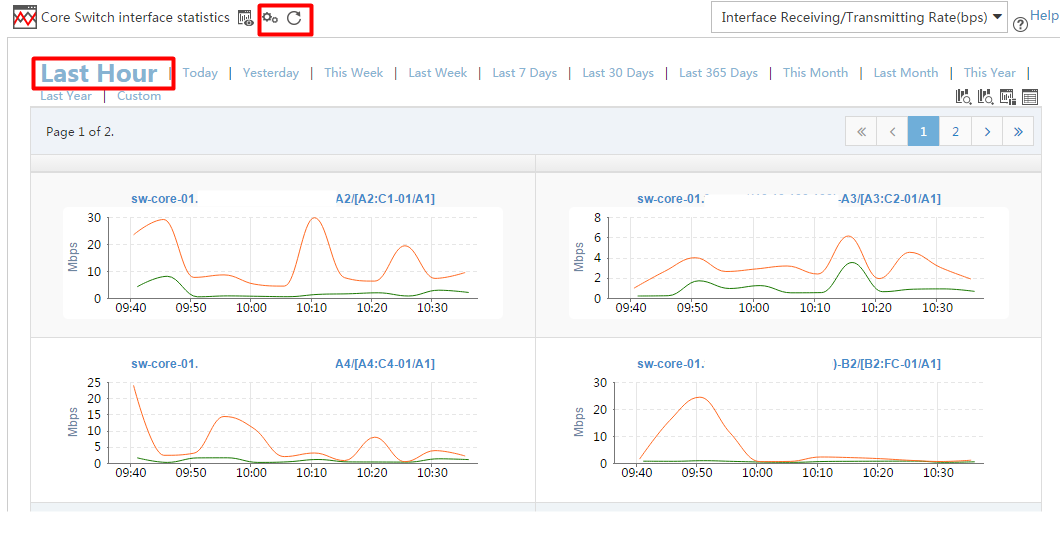
- you can adjust the amount of data shown by clicking the links at the top of the page
3B. Monitoring using Tiling
- point your mouse at the gold Star - Display Tiling - Configuration
- Click and drag the Performance Trend button into the screen area with the grids
- stretch the box to fit on the screen
- right click - parameter configuration
- add instance
- scroll down and select System Interface Statistics
- expand the switch(es) and select the ports you setup during the monitoring phase - do this for Interface receive rate and transmit rate (bps) - OK when done. OK..
- click the SAVE icon!
- close the configuration screen
- go back to the Gold Arrow - Display Tiling - Select the view you just setup.
Note: the display tiling is meant for monitoring on a screen in a network operations center. We have 4 monitors going, each with multiple windows on it. As you add more monitoring (maybe you have sites with 2 T1s, you could setup a new monitoring instance for those ports), you can add more performance trends to the screen and tile them to fit next to each other on a screen.
I'll leave this alone for now. give this a try. post a reply and I will check back to see if I forgot a step and left you in the lurch.
Keith
- Mark as New
- Bookmark
- Subscribe
- Mute
- Subscribe to RSS Feed
- Permalink
- Report Inappropriate Content
11-10-2015 06:03 AM - edited 11-10-2015 06:05 AM
11-10-2015 06:03 AM - edited 11-10-2015 06:05 AM
Re: Viewing Network Bandwidth Utilization?
3A - Monitoring traffic on demand
- Click Resource - Performance Mangement - Performance View
It's almost perfect graph, but it's not conveniently that there is no auto refresh option. It's not comfortable also to get this information from the separate page. Is it possible to place this window as a widget on the Home screen?
3B. Monitoring using Tiling
It's not comfortable that we get two grafs (receive and transmit) instead of one combined. Is it possible somehow to combine two graphs into one, like we have in 3A?
- Mark as New
- Bookmark
- Subscribe
- Mute
- Subscribe to RSS Feed
- Permalink
- Report Inappropriate Content
11-11-2015 11:47 AM
11-11-2015 11:47 AM
Re: Viewing Network Bandwidth Utilization?
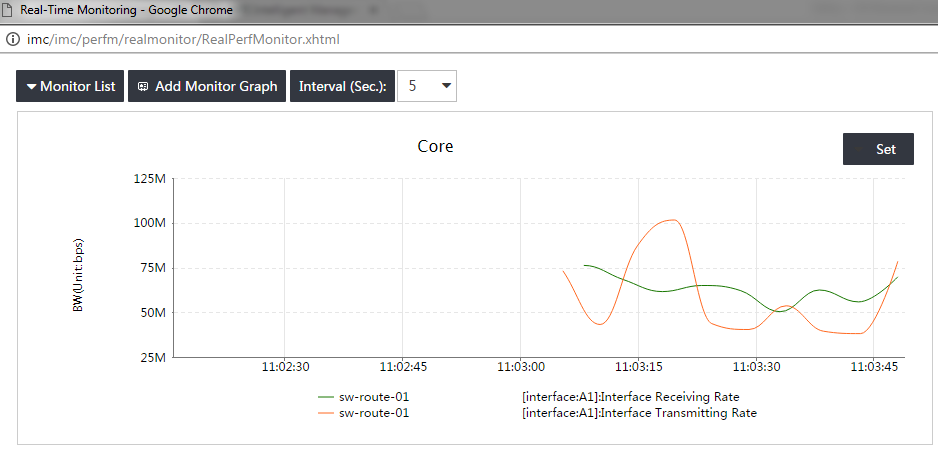
If you want a continuous view use the real time monitoring under performance management. Set up is similar.
You get a 5 min sliding window of real time data. You can have multiple graphs per monitor, and multiple monitors but you can only view one monitor collection at a time. Transmit and recieve can be on the same graph.
No history unfortunately.
Would be nice if the configurations could be set up once and then used in multiple modules, but not currently the case.
- Mark as New
- Bookmark
- Subscribe
- Mute
- Subscribe to RSS Feed
- Permalink
- Report Inappropriate Content
11-12-2015 05:43 AM
11-12-2015 05:43 AM
Re: Viewing Network Bandwidth Utilization?
Dear NeilR,
Thanks for your answer. Your graph looks excellent, but it's not comfortable to get this information from the separate page.
I can't understand why is it not possible to place this graph as a widget on the Home screen, custom dashboard or Tiling.
- Mark as New
- Bookmark
- Subscribe
- Mute
- Subscribe to RSS Feed
- Permalink
- Report Inappropriate Content
11-13-2015 09:53 AM
11-13-2015 09:53 AM
Re: Viewing Network Bandwidth Utilization?
Yes- share some of your frustration. I suspect the evloution of imC as in integrated modular product, worked on by different teams may be responsible. Its more intergated than a collection of idividual tools, but there are gaps and barriers in the way data is managed, accessed and displayed.
That said, I still find it quite powerful and useful enough to overcome that frustration. I hope HP can increase the resources to address these kinds of issue.
- Mark as New
- Bookmark
- Subscribe
- Mute
- Subscribe to RSS Feed
- Permalink
- Report Inappropriate Content
04-04-2017 05:32 AM
04-04-2017 05:32 AM
Re: Viewing Network Bandwidth Utilization?
Version 7.2 and stil no option that lets you have graphs of your switches that are automatically updated every few minutes?
I have gone through setting up performance monitors and still lcant figure out how to use this software effectivly as the free snmp application Cacti. Am I missinf somthing?
- Mark as New
- Bookmark
- Subscribe
- Mute
- Subscribe to RSS Feed
- Permalink
- Report Inappropriate Content
04-04-2017 11:14 AM
04-04-2017 11:14 AM
Re: Viewing Network Bandwidth Utilization?
I'm looking at real time monitor (Resoruce . Performance Management . Real Time monitor) - see picture attached. Updates at your chosen interval after you specify the devices and interfaces to monitor.
Also for each device any selected monitors can be displayed. But by default its cpu, mem, response time - you need to add interface stats.
NTA is not quite real time as its polling and analyzing for various breakdown.
If this was not what you were looking for please clarify
- Mark as New
- Bookmark
- Subscribe
- Mute
- Subscribe to RSS Feed
- Permalink
- Report Inappropriate Content
04-04-2017 11:36 AM
04-04-2017 11:36 AM
Re: Viewing Network Bandwidth Utilization?
No this live performance graph is not very usefull.
I want a page showing the traffic of active interfaces for each device in my network.
I want to be able to look back for days, months and years.
- Mark as New
- Bookmark
- Subscribe
- Mute
- Subscribe to RSS Feed
- Permalink
- Report Inappropriate Content
04-06-2017 10:52 AM
04-06-2017 10:52 AM
Re: Viewing Network Bandwidth Utilization?
Performance management > Performance View is probably your best bet then.
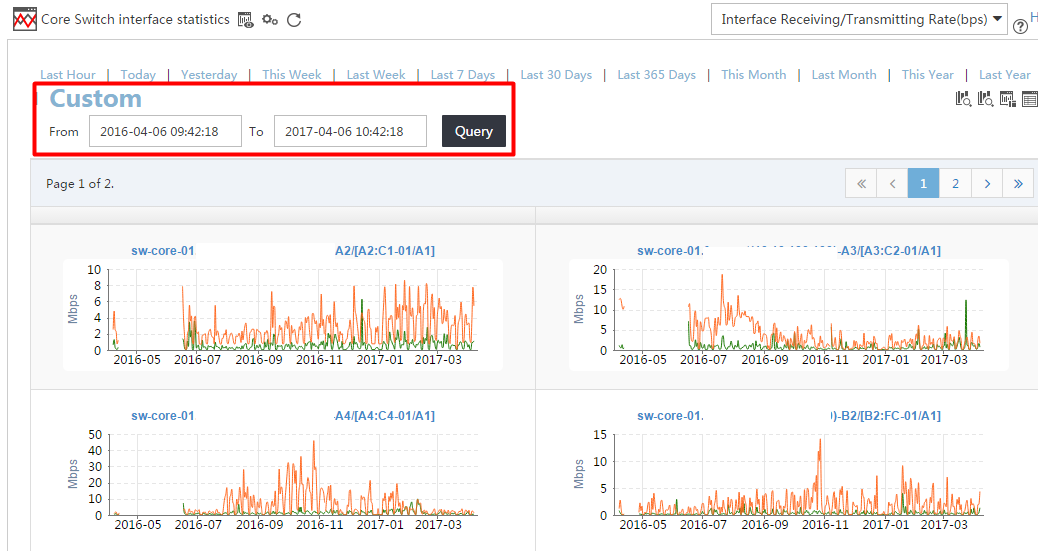
You can then view by various time ranges including custom. I don't think it auto refreshes though. Also as this is stored in your DB there will be limits to how much historical data you'll keep
- Mark as New
- Bookmark
- Subscribe
- Mute
- Subscribe to RSS Feed
- Permalink
- Report Inappropriate Content
04-06-2017 11:07 AM
04-06-2017 11:07 AM
Re: Viewing Network Bandwidth Utilization?
Thank You
Yes that is closer but the limitations are very restrictive.
Only 150 intstances s can be graphed in a group
Only 6 rows per page can be viewd and you have to manually refresh.
Close but very
- Mark as New
- Bookmark
- Subscribe
- Mute
- Subscribe to RSS Feed
- Permalink
- Report Inappropriate Content
04-07-2017 04:57 AM
04-07-2017 04:57 AM
Re: Viewing Network Bandwidth Utilization?
I had a break through.
If you go to port group and create a new group name.
Add the ports you want.
There is an option to create a performance view which I did and it didnt limit me to 150 interfaces.
I had one view with over 1000!!!!
Just need to get it to auto refresh and display more graps per page.
- Mark as New
- Bookmark
- Subscribe
- Mute
- Subscribe to RSS Feed
- Permalink
- Report Inappropriate Content
04-07-2017 05:01 AM
04-07-2017 05:01 AM
Re: Viewing Network Bandwidth Utilization?
1000 graphs.
Still limited to 900 interfaces. Doh


