- Community Home
- >
- Storage
- >
- Around the Storage Block
- >
- InfoSight Cross Stack Analytics Performance Recomm...
Categories
Company
Local Language
Forums
Discussions
Forums
- Data Protection and Retention
- Entry Storage Systems
- Legacy
- Midrange and Enterprise Storage
- Storage Networking
- HPE Nimble Storage
Discussions
Forums
Discussions
Discussions
Forums
Discussions
Discussion Boards
Discussion Boards
Discussion Boards
Discussion Boards
Discussion Boards
Discussion Boards
Discussion Boards
Discussion Boards
Discussion Boards
Discussion Boards
Discussion Boards
Discussion Boards
Discussion Boards
Discussion Boards
Discussion Boards
Discussion Boards
Discussion Boards
Discussion Boards
Discussion Boards
Discussion Boards
Discussion Boards
Discussion Boards
Discussion Boards
Community
Resources
Forums
Blogs
- Subscribe to RSS Feed
- Mark as New
- Mark as Read
- Bookmark
- Receive email notifications
- Printer Friendly Page
- Report Inappropriate Content
InfoSight Cross Stack Analytics Performance Recommendations
Cross-stack Analytics and storage performance recommendations are not new to InfoSight. HPE InfoSight Cross Stack Analytics for VMware environments provides performance correlation analytics to help you identify the leading factors affecting performance, while avoiding significant manual data collection and analysis. Cross-Stack Analytics provides a granular view of the resources that are used by every VM. This feature makes it possible to correlate the performance of VMs in a datastore with insights into hypervisor and host resource constraints such as vCPU, memory, and network.
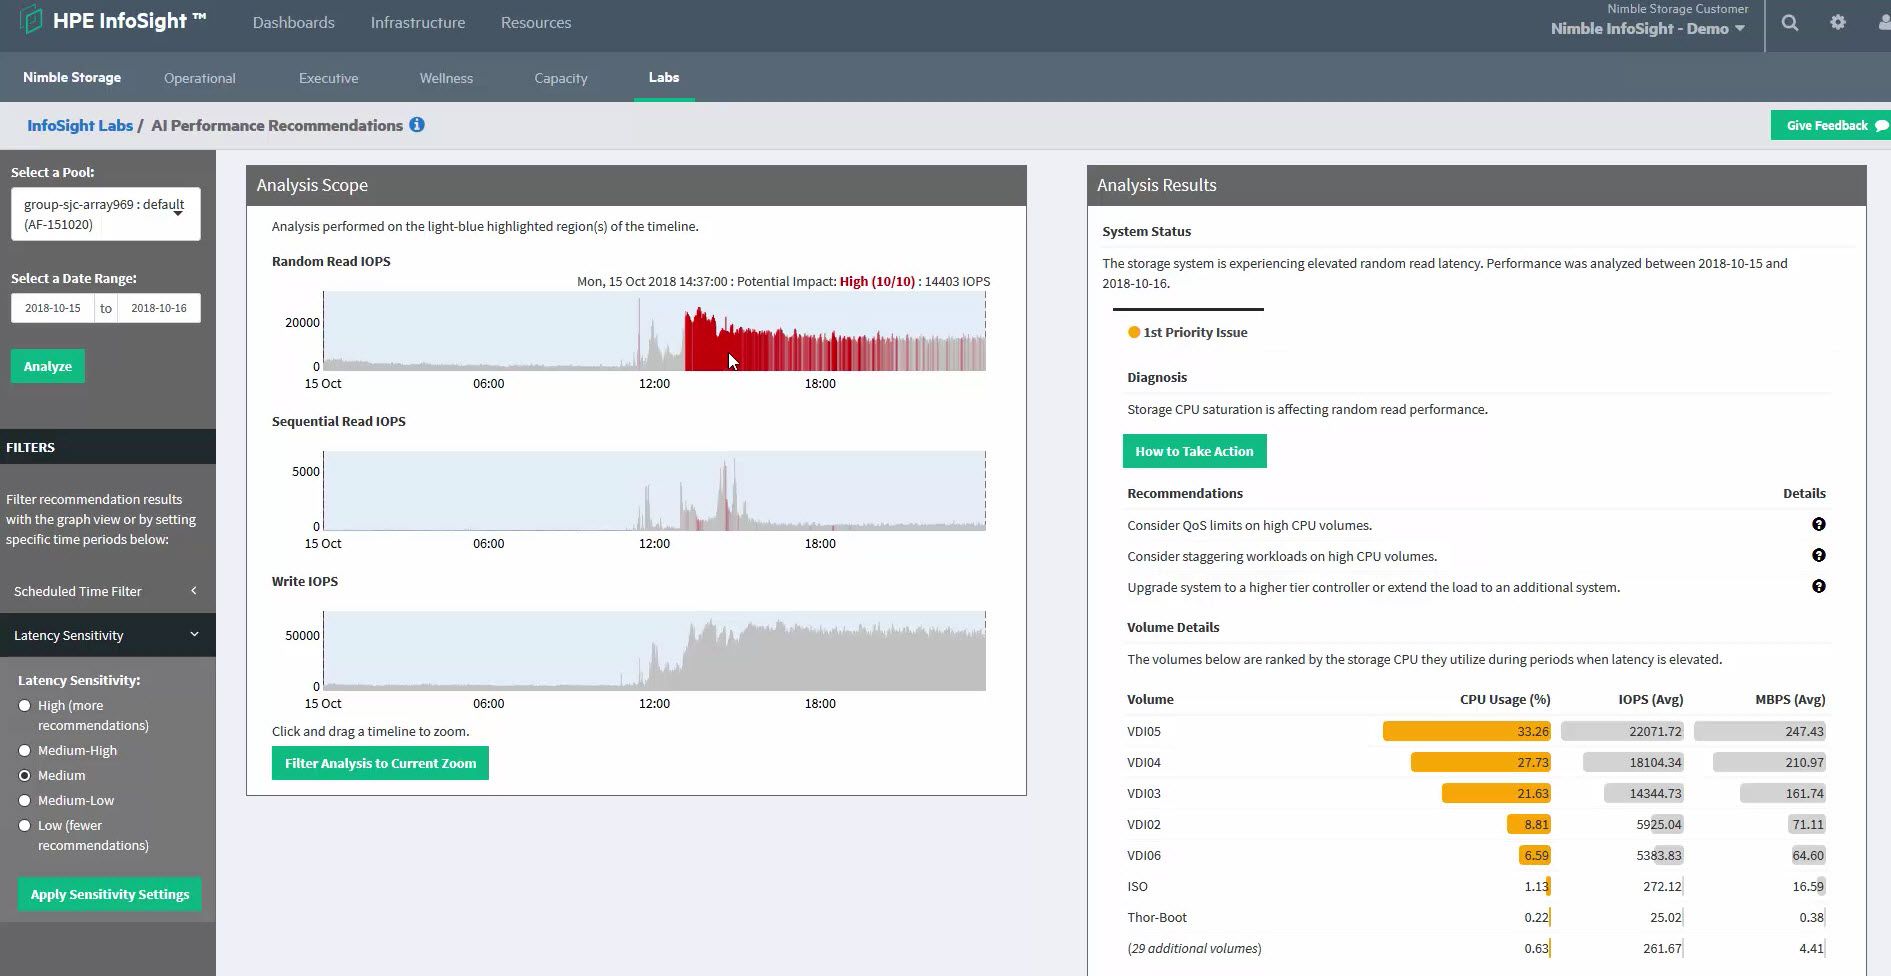
InfoSight currently provides detailed explicit storage performance recommendations through the AI Performance recommendation engine under HPE InfoSight labs. With this tool the admin can figure out what issues are plaguing the environment and a detailed list of rank sorted recommendations are provided. The screenshot below shows a scenario were the AI performance recommendations are provided for an array that has been running an intense workload over a defined period of time (this time frame can be sorted by working hours or off-hours). The recommendations covers detail diagnosis of the problem, providing ranked recommendations followed by explicit mentions of the volumes in that array that are running hot due to high CPU usage on the controllers.
HPE InfoSight now has taken this analytics and AI recommendation one step further by providing additional recommendations based on Host CPU and Memory diagnosis as well as latency diagnoses of VMs experiencing issues due to resource contention issues.
Dedicated models for storage existed but we are now extending it to the host and VM level. We rank the issues for an easier triaging model. Recognizing the problem and highlighting them.
In the example below we found an issue with VM performance degradation due to overprovisioning of vCPU which was creating contention issues.
Appropriate ranked recommendations are provided based on the host and neighbouring VM performance. The premise was based on the fact that there were impacted VMs and overprovisioned host. We can then drill down into impacted hosts and VMs and which bully VMs are causing the environment to have performance degradation.
There are two different views that are provided. The Tree map and Sankey View.
Tree map is to immediately determine what potion of environment is affected. This view gives additional details of VMs on how many vCPUs assigned and also their CPU contention by the colour.
Sankey is to understand the connectivity between different layers of the infrastructure stack – storage arrays to the left, datastores in the middle and hosts on the right. The width of the lines connecting them indicates the amount the IO traffic and the colour of arrays, datastores and hosts denotes how much CPU contention is present with the associated VMs.
The best part of this diagnosis is we have insights into multiple vCenter, hosts and multiple arrays. This way we provide detailed and localized diagnosis of the environment.
We also provide details in elevated latency if found. In the figure below, VM with elevated latency was diagnosed and recommendation was provided with the source name of the VM that was causing high latency. This is usually helpful in troubleshooting bulling workloads/VMs. The recommendations are labeled thereby you can easily identify and pin point where the problem source whether it be storage, VM, host or network.
There you have it. A detailed overview of how the latest InfoSight performance recommendation engine can eliminate the pain of triaging and finding the root cause of a performance problem and instead performing exact diagnostic of the problem and providing prioritized recommendations.
To learn more about HPE InfoSight please visit HPE InfoSight
- Back to Blog
- Newer Article
- Older Article
- haniff on: High-performance, low-latency networks for edge an...
- StorageExperts on: Configure vSphere Metro Storage Cluster with HPE N...
- haniff on: Need for speed and efficiency from high performanc...
- haniff on: Efficient networking for HPE’s Alletra cloud-nativ...
- CalvinZito on: What’s new in HPE SimpliVity 4.1.0
- MichaelMattsson on: HPE CSI Driver for Kubernetes v1.4.0 with expanded...
- StorageExperts on: HPE Nimble Storage dHCI Intelligent 1-Click Update...
- ORielly on: Power Loss at the Edge? Protect Your Data with New...
- viraj h on: HPE Primera Storage celebrates one year!
- Ron Dharma on: Introducing Language Bindings for HPE SimpliVity R...


