- Community Home
- >
- Servers and Operating Systems
- >
- Operating Systems
- >
- Operating System - OpenVMS
- >
- Re: Help! - Performance Problem - Can't find 4 CPU...
Categories
Company
Local Language
Forums
Discussions
- Integrity Servers
- Server Clustering
- HPE NonStop Compute
- HPE Apollo Systems
- High Performance Computing
Knowledge Base
Forums
- Data Protection and Retention
- Entry Storage Systems
- Legacy
- Midrange and Enterprise Storage
- Storage Networking
- HPE Nimble Storage
Discussions
Knowledge Base
Forums
Discussions
- Cloud Mentoring and Education
- Software - General
- HPE OneView
- HPE Ezmeral Software platform
- HPE OpsRamp Software
Knowledge Base
Discussions
Forums
Discussions
Discussion Boards
Discussion Boards
Discussion Boards
Discussion Boards
Discussion Boards
Discussion Boards
Discussion Boards
Discussion Boards
Discussion Boards
Discussion Boards
Discussion Boards
Discussion Boards
Discussion Boards
Discussion Boards
Discussion Boards
Discussion Boards
Discussion Boards
Discussion Boards
Discussion Boards
Discussion Boards
Discussion Boards
Discussion Boards
Discussion Boards
Community
Resources
Forums
Blogs
- Subscribe to RSS Feed
- Mark Topic as New
- Mark Topic as Read
- Float this Topic for Current User
- Bookmark
- Subscribe
- Printer Friendly Page
- Mark as New
- Bookmark
- Subscribe
- Mute
- Subscribe to RSS Feed
- Permalink
- Report Inappropriate Content
05-19-2014 08:54 AM
05-19-2014 08:54 AM
Help! - Performance Problem - Can't find 4 CPU are been loaded!
Hi
I been leading with a system tuning for a while and cant find a way to determine why
few specifics type of process are ocerloading the 4 CPU on this OpenVMS Alpa ES47
The application is Centricity Business with Cache (previously name IDX-FlowCast)
Normally when some specific type of processes which generated reports in background
even they are running on low priority they take high CPU. This system is normally loede with
800 + interactive users with NO issue until these type of processes run, where the monitor
mode chart show a continous steady User-Mode of 365% (4 CPU) If they are not running
it stays around 230 %
Attached is a file with all information I believe is pertinent to obtain an idea
how the system has been setup (parameters, etc) and its behavior.
Can anybody notice anything weird that aI may be overlooking?
Please, dont reply if you don't take time to analyze the attachement.
Thank you.
- Mark as New
- Bookmark
- Subscribe
- Mute
- Subscribe to RSS Feed
- Permalink
- Report Inappropriate Content
05-19-2014 09:07 AM
05-19-2014 09:07 AM
Re: Help! - Performance Problem - Can't find 4 CPU are been loaded!
Edmundo,
those jobs are cache jobs. You need to find out, what they are doing. Maybe looping for something to happen instead of waiting ?
Volker.
- Mark as New
- Bookmark
- Subscribe
- Mute
- Subscribe to RSS Feed
- Permalink
- Report Inappropriate Content
05-19-2014 10:00 AM
05-19-2014 10:00 AM
Re: Help! - Performance Problem - Can't find 4 CPU are been loaded!
I been monitoring them and they are having a lot of IO because they are actually
searching-writing. Theya are the type process we call report attached processes.
- Mark as New
- Bookmark
- Subscribe
- Mute
- Subscribe to RSS Feed
- Permalink
- Report Inappropriate Content
05-19-2014 10:15 AM - edited 05-19-2014 10:16 AM
05-19-2014 10:15 AM - edited 05-19-2014 10:16 AM
Re: Help! - Performance Problem - Can't find 4 CPU are been loaded!
Edmundo,
so these processes are searching in the database and writing reports - o.k. With an OpenVMS priority of 0, they are not taking CPU cycles aways from others processes with higher priorities, they are just consuming all the - otherwise idle - CPU cycles.
What is the perceived problem ? Is there any ? Except the system being at 365% CPU utilization ?
Volker.
- Mark as New
- Bookmark
- Subscribe
- Mute
- Subscribe to RSS Feed
- Permalink
- Report Inappropriate Content
05-19-2014 12:03 PM
05-19-2014 12:03 PM
Re: Help! - Performance Problem - Can't find 4 CPU are been loaded!
Hi Volker
Yes, there are two problems
1. the actual reports are taking too long to be produced
2. sometime users are complaining about system been slow
I know as you may notice in the attachement that some of the disk-volumes are quiet fragmented
some of them hold huge Caché (MUMPs) databases and duw to this a 24x7/365 system is very difficult
to obtain time to work in disk or database de-fragmentation/compation. This may be causing high IO
hence CPU but I have not been able to directly relate this type of specific reports run with that effect.
I may have some fog in my eyes!
- Mark as New
- Bookmark
- Subscribe
- Mute
- Subscribe to RSS Feed
- Permalink
- Report Inappropriate Content
05-19-2014 11:16 PM
05-19-2014 11:16 PM
Re: Help! - Performance Problem - Can't find 4 CPU are been loaded!
Edmundo,
severe disk fragmentation is only a noticable problem, if there is signifcant IO on those fragmented disks. As the Window Turn Rate is very low and the most fragmented disks (except maybe DSA450:) have a very light IO rate, I don't think disk fragmentation is a problem here.
MONITOR may not be the right tool to investigate such a performance problem, especially if the 'slow performance' only show up 'sometimes'. Consider using T4, it will give you much more detailled performance data at 1-minute intervals.
Volker.
- Mark as New
- Bookmark
- Subscribe
- Mute
- Subscribe to RSS Feed
- Permalink
- Report Inappropriate Content
05-20-2014 05:22 AM
05-20-2014 05:22 AM
Re: Help! - Performance Problem - Can't find 4 CPU are been loaded!
I agree with Volker.
T4 with TLVIZ can help spot correlations that are not otherwise readily apparent. Also you can add application-specific data items to the analysis.
I wouldn't be too quick to rule out an application-related cause to the perceived slow downs. I didn't see any OS locking statistics in your post, but contention for a shared resource, like a shared counter, can often cause applications to spin in user mode (I don't know how cache internally handles such things or what paradigms are available to the programmer to deal with them; its conceivable they may not even use the distributed lock manager and therefore be invisible to Monitor).
- Mark as New
- Bookmark
- Subscribe
- Mute
- Subscribe to RSS Feed
- Permalink
- Report Inappropriate Content
05-20-2014 06:48 AM
05-20-2014 06:48 AM
Re: Help! - Performance Problem - Can't find 4 CPU are been loaded!
Dan
- Mark as New
- Bookmark
- Subscribe
- Mute
- Subscribe to RSS Feed
- Permalink
- Report Inappropriate Content
05-20-2014 10:23 PM
05-20-2014 10:23 PM
Re: Help! - Performance Problem - Can't find 4 CPU are been loaded!
What length are the I/O queues to your disks?
$ MONITOR DISK/ITEM=QUEUE_LENGTH
Even if the queue is 0.3 on average, that means that a disk I/O will have to wait 1 time in 3 because there's an I/O request ahead of it.
Also, is this a recent problem on what was a happily running system? If so, what's changed?
- Mark as New
- Bookmark
- Subscribe
- Mute
- Subscribe to RSS Feed
- Permalink
- Report Inappropriate Content
05-21-2014 09:53 AM
05-21-2014 09:53 AM
Re: Help! - Performance Problem - Can't find 4 CPU are been loaded!
HI again
I am sorry for takin too long to foolow your replies. Thank you all for the insight.
No doubt about it in connection with Monitor vs. T4... I do run T4 for long time
I tought it was much simple to provide that Monitor chart instead of embeading T4 charts.
Now, take a look at the attached presentation based on T4 for the hole month of may-2014
and you are going to notice more clearly the difference whn I have those type of reporting processes
and those that are not.
Look at the beginning of the month when we run the closing and all Mondays (2, 12, 19)
What I noticed is that that CPU load doesn't correlate with CPU acticity in other modes
like Direct IO, Buffere IO, Interrupt or MP Sync. Nor with Monitor Compute state.
What I do notice is that seems like the overall cache, specifically Cache reads (High) and Free cache (Low)
do correlate some how. The only thing I did not long ago was to increase some of the cache seen on
"File System Caching" like Dir-Data, File-Hdr, File-ID connected with ACP_* quotas and then run autogen.
But only see a little bit improvement.
Some how is my believe that Disk IO (Files (db) sear and writes) are affecting).
Anyhow, please take a look at the T4 *comp.VSC (if you have TlViz) for Monday-Tuesday
and let me know if you can see anything disturbing.
- Mark as New
- Bookmark
- Subscribe
- Mute
- Subscribe to RSS Feed
- Permalink
- Report Inappropriate Content
05-21-2014 10:09 AM - edited 05-21-2014 10:26 AM
05-21-2014 10:09 AM - edited 05-21-2014 10:26 AM
Re: Help! - Performance Problem - Can't find 4 CPU are been loaded!
Some how the PowerPointShow is not uploading...
Iam adding two chart.zip files
Does anybody know how to upload *.pps or *.ppsx type of file here?
I dont want to upload the *.ppt (maybe a *.htm)
- Mark as New
- Bookmark
- Subscribe
- Mute
- Subscribe to RSS Feed
- Permalink
- Report Inappropriate Content
05-21-2014 11:11 AM - edited 05-21-2014 11:15 AM
05-21-2014 11:11 AM - edited 05-21-2014 11:15 AM
Re: Help! - Performance Problem - Can't find 4 CPU are been loaded!
>Does anybody know how to upload *.pps or *.ppsx type of file here?
The simplest is just zip them up and attach.
Otherwise you'll need to add .txt to the end and then mention that the reader will have to remove it after downloading.
jpg,gif,pdf,png,doc,docx,ppt,pptx,xls,xlsx,zip,txt,sh,ksh,rar,pps,csv,log,ics,unl are the valid extensions.
- Tags:
- attachments
- Mark as New
- Bookmark
- Subscribe
- Mute
- Subscribe to RSS Feed
- Permalink
- Report Inappropriate Content
05-21-2014 11:51 AM
05-21-2014 11:51 AM
Re: Help! - Performance Problem - Can't find 4 CPU are been loaded!
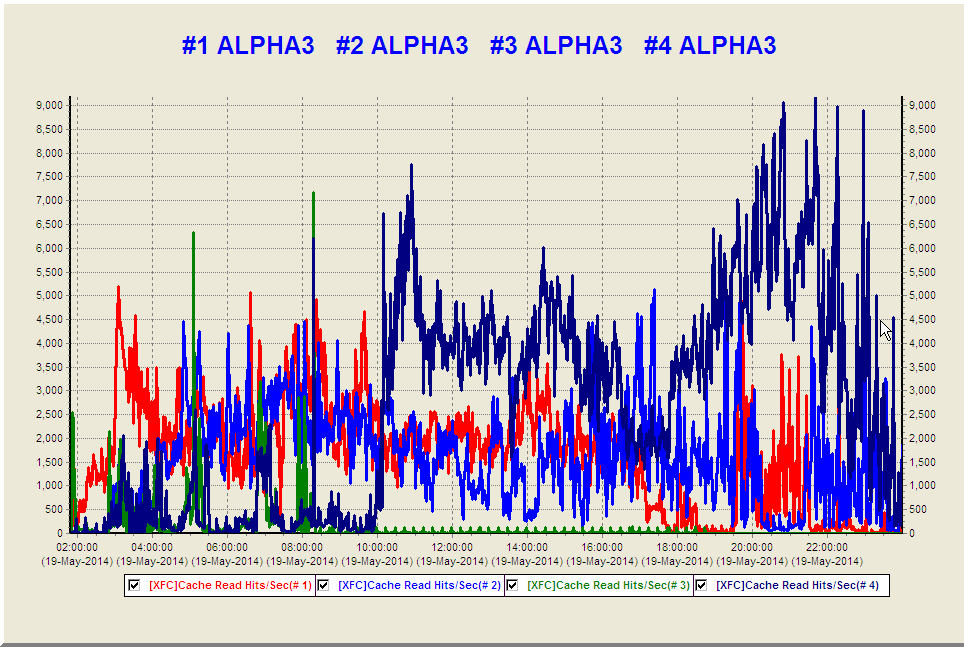
I loaded up the two CSV files into TLViz and the only thing I can see of note after looking at all of the collected data is that during the period when the CPUs are saturated on the 19th, the XFC Read I/O rate is very high (about double to triple the average for the 20th).
Since these reads are being satisfied out of the XFC, there is a possibility that this is a read to a common resource (high data locality) that perhaps contains a counter or a flag and the processes are spinning reading it with no wait time between reads (there is no corresponding higher rate of writes). This may be especially so since your original post indicated only an overall ~68% XFC read hit ratio on a 98% read attempt rate, so it appears your normal data access pattern does not have as high of locality as we see during the saturation period.
There does not appear to be any system-related bottleneck here. This looks more and more like an issue within the application.
- Mark as New
- Bookmark
- Subscribe
- Mute
- Subscribe to RSS Feed
- Permalink
- Report Inappropriate Content
05-22-2014 08:36 PM - edited 05-22-2014 09:21 PM
05-22-2014 08:36 PM - edited 05-22-2014 09:21 PM
Re: Help! - Performance Problem - Can't find 4 CPU are been loaded!
Thank you Dennis
Nice hint, i am uploading the presentation but may not be that relevant at this point.
I will attaching some file later.
The attached file is a Power-Point-Show file.
in order to be able to see the presentation remove the (.txt - dot.txt) at the end
and it will become *.pps file
- Mark as New
- Bookmark
- Subscribe
- Mute
- Subscribe to RSS Feed
- Permalink
- Report Inappropriate Content
05-22-2014 09:34 PM - edited 05-22-2014 09:38 PM
05-22-2014 09:34 PM - edited 05-22-2014 09:38 PM
Re: Help! - Performance Problem - Can't find 4 CPU are been loaded!
Mike, that is a very good observation and analysis in short words.
I have a concern with the reduction of the 'overall XFC read hit ratio' onec in while but your inputs are valid.
I am performing some analysis and will bring a posting later on with some charts.
Meanwhile I am attaching one chart showing the XFC read on all days with pertinent high CPU.
(Mondays: 5, 12, 19) and 2-May Friday (closing day) Monday 19 (red backwards).
I look forward to obtain more enlighment thank you to all inputs!